Teaching data and graphing to third grade students combines previously-learned math concepts with making sense of and organizing the information of everyday statistics. Furthermore, it allows them to communicate their reasoning and mathematical thinking. When students become comfortable and efficient in understanding and using graphs, they are eventually able to apply these skills to more complex data analysis.
This Data and Graphing Unit teaches how to use line plots, pictographs, bar graphs and frequency tables. This unit also gives practice for measuring in inches and centimeters to the nearest 1/4 unit. These are all skills that students can use throughout their lives.
SAVE $$$ WITH THE BUNDLE
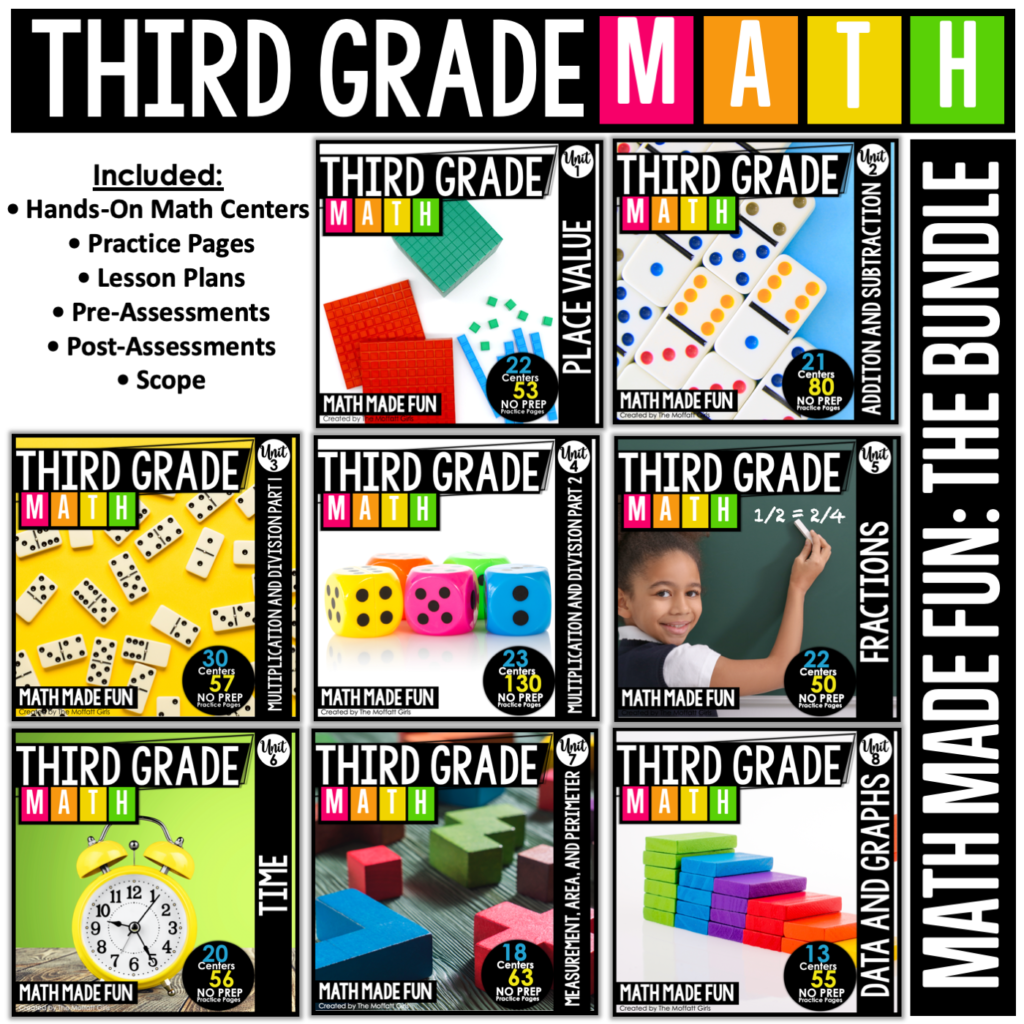
ALL 8 UNITS INCLUDED!
Here are the 8 Units that will be included in the 3rd Grade: Math Made Fun Curriculum
Unit 1:Place Value
Unit 2: Addition and Subtraction
Unit 3:Multiplication and Division (Part 1)
Unit 4: Multiplication and Division (Part 2)
Unit 5: Fractions
Unit 6: Time
Unit 7: Measurement, Area, and Perimeter
Unit 8: Data and Graphs
This 3rd Grade Math Made Fun Unit 8 has 13 hands-on math centers and 55 NO PREP/Activity pages!
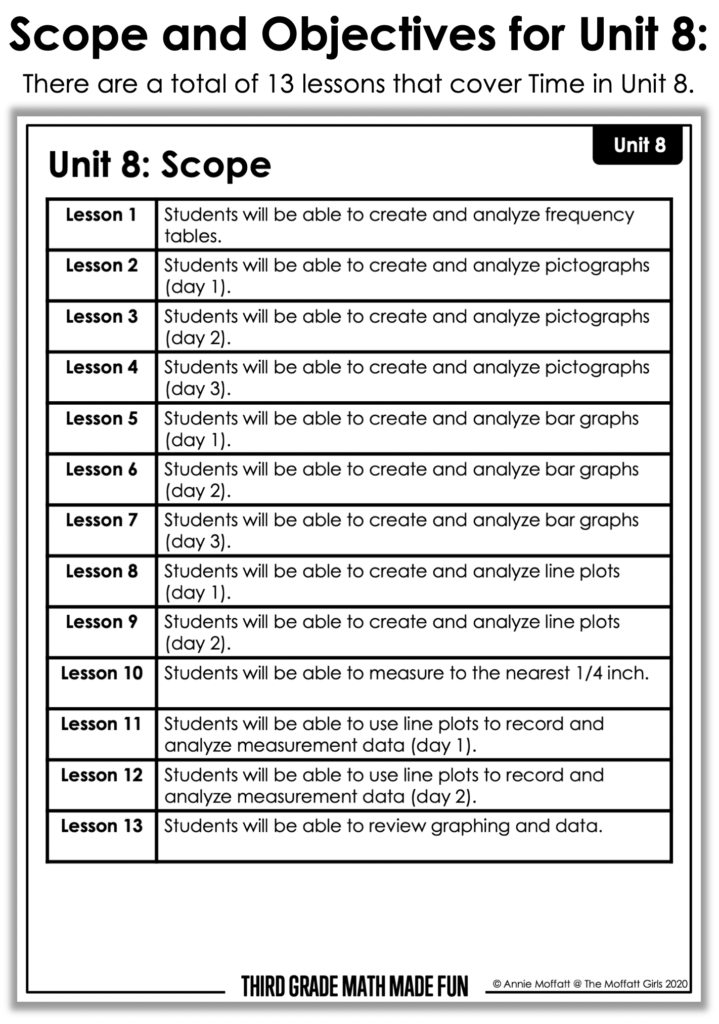
EACH UNIT INCLUDES A SCOPE WITH THE OBJECTIVES:
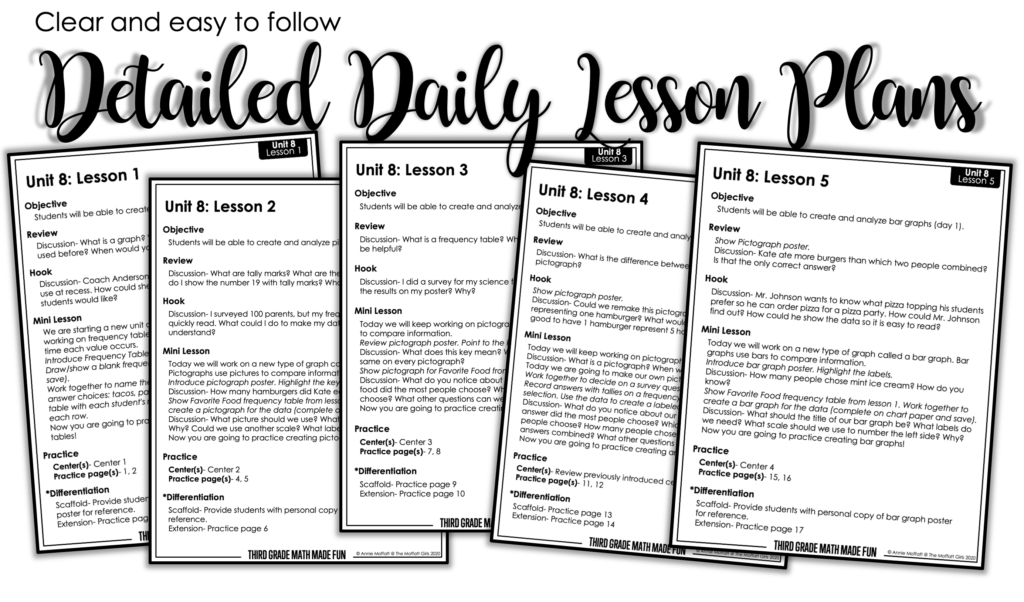
The Daily Lesson Plans offer differentiation for on-level, below-level and above-level students.
The lesson plans are broken down into 5 easy-to-follow parts:
1. Objective– What students should be able to do by the end of the lesson.
2. Review- A quick warm-up that has students practice previous skills that will be used in the current lesson.
3. Hook-A fun intro to get students engaged.
4. Mini-Lesson– Teach, model, and discuss the new skill in today’s lesson.
5. Practice- Each practice section lists three types of activities that pair well with the specific lesson.
Center(s)- New center(s) to be introduced with the lesson.
Activity Pages- These pages require some basic materials such as scissors, glue or dice.
Practice Pages- These only require a pencil and crayons! They are great for table work, homework or work on the go!
✸Differentiation– Each lesson include scaffold and extension ides to meet the needs of students at all levels!
You can purchase Unit 8 individually HERE
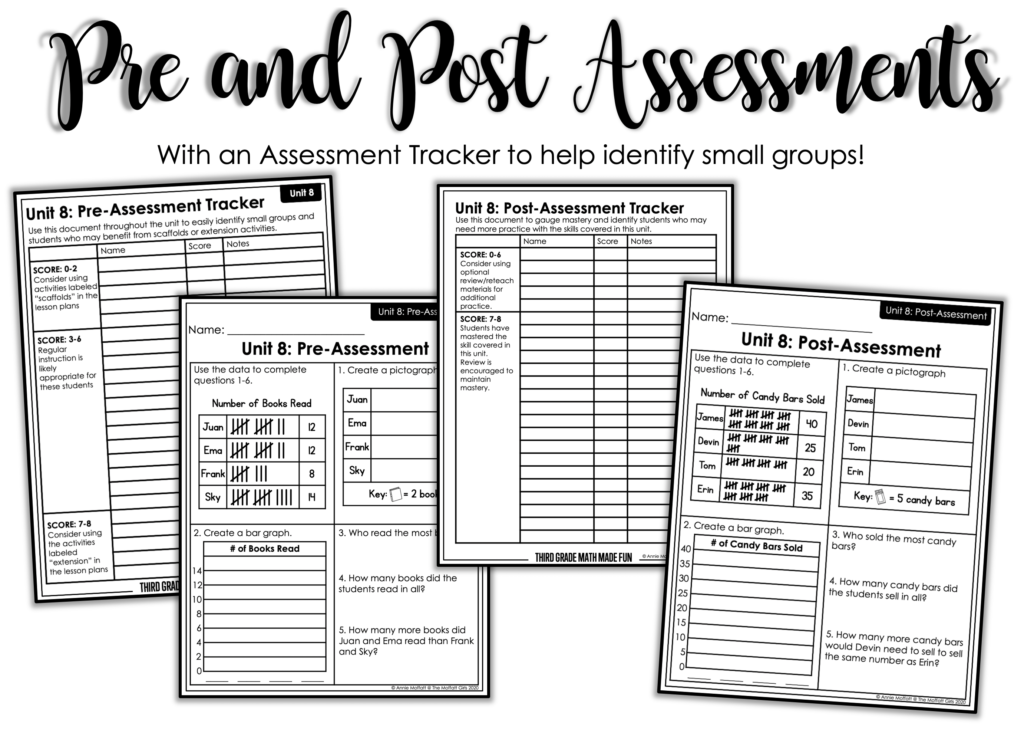
PRE AND POST ASSESSMENTS FOR EACH UNIT!
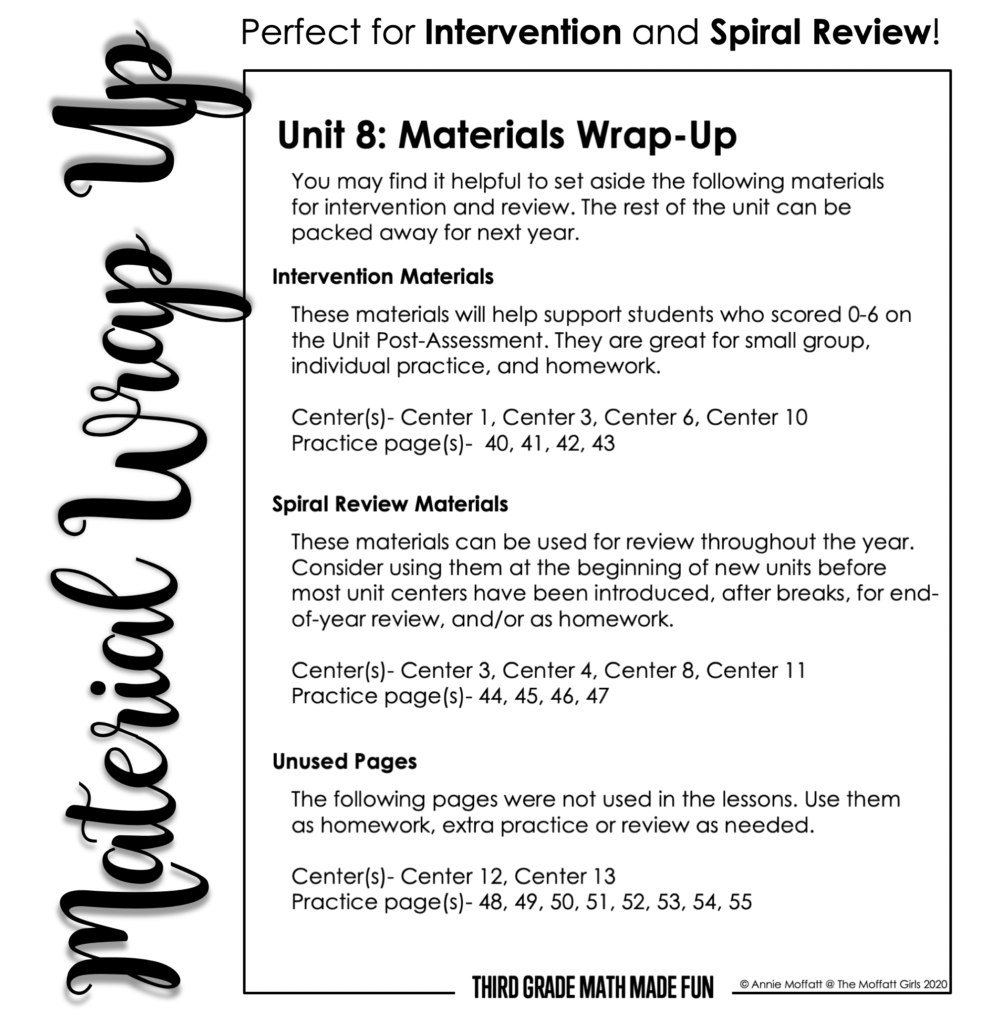
MATERIAL WRAP UP PAGE!
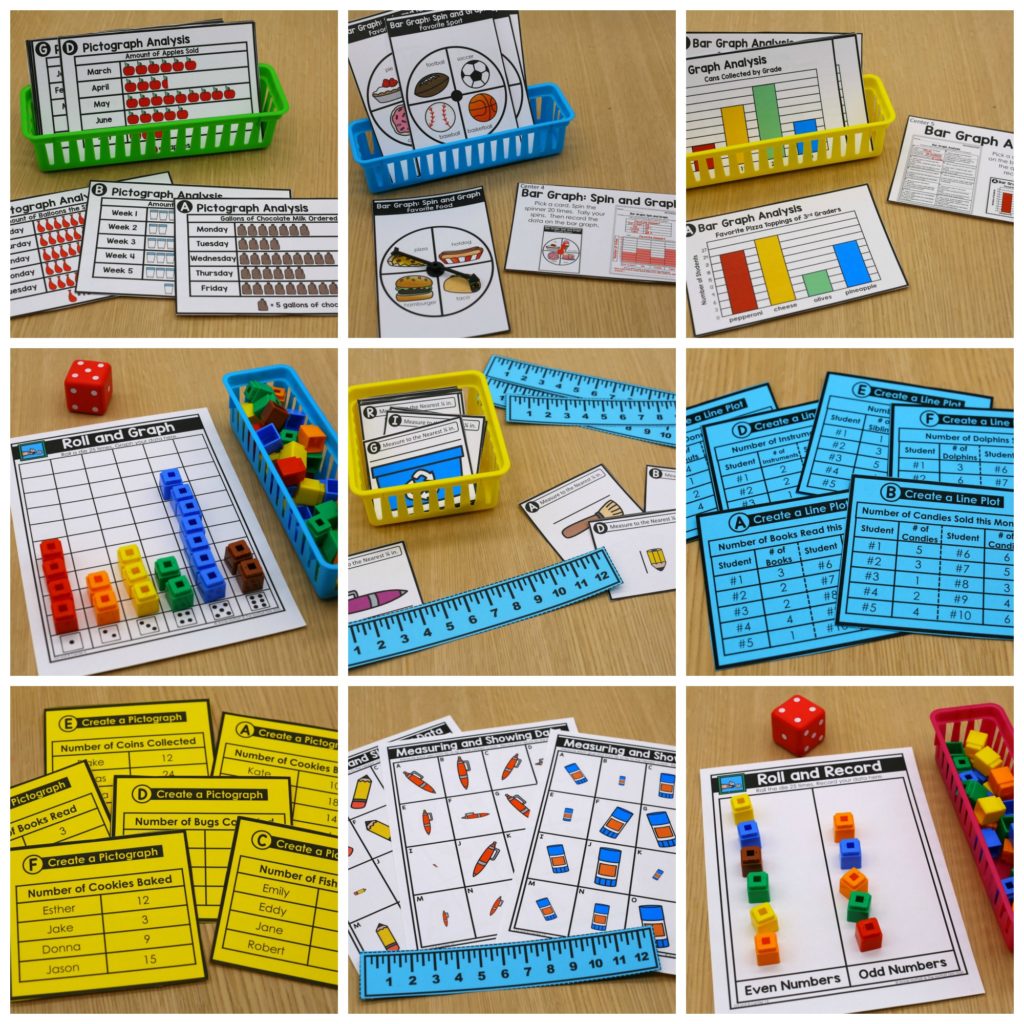
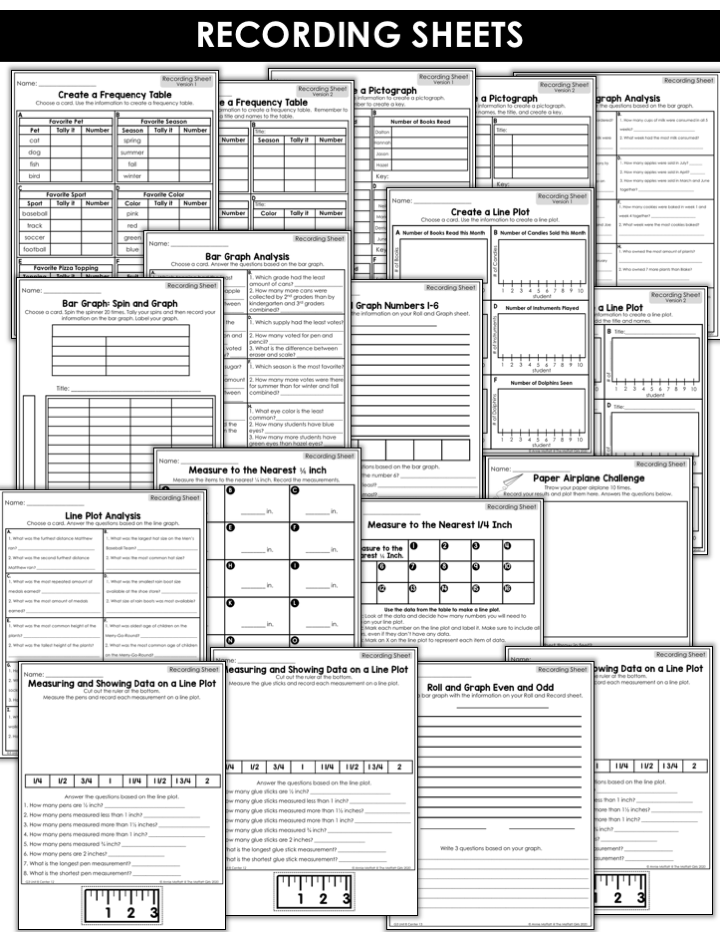
Each center includes a corresponding recording sheet to go with the activity and display a student’s level of mastery. Also, some centers include 2 different levels of recording sheets for differentiation.
LET’S LOOK AT THE MATH CENTERS FOR UNIT 8 IN ACTION…
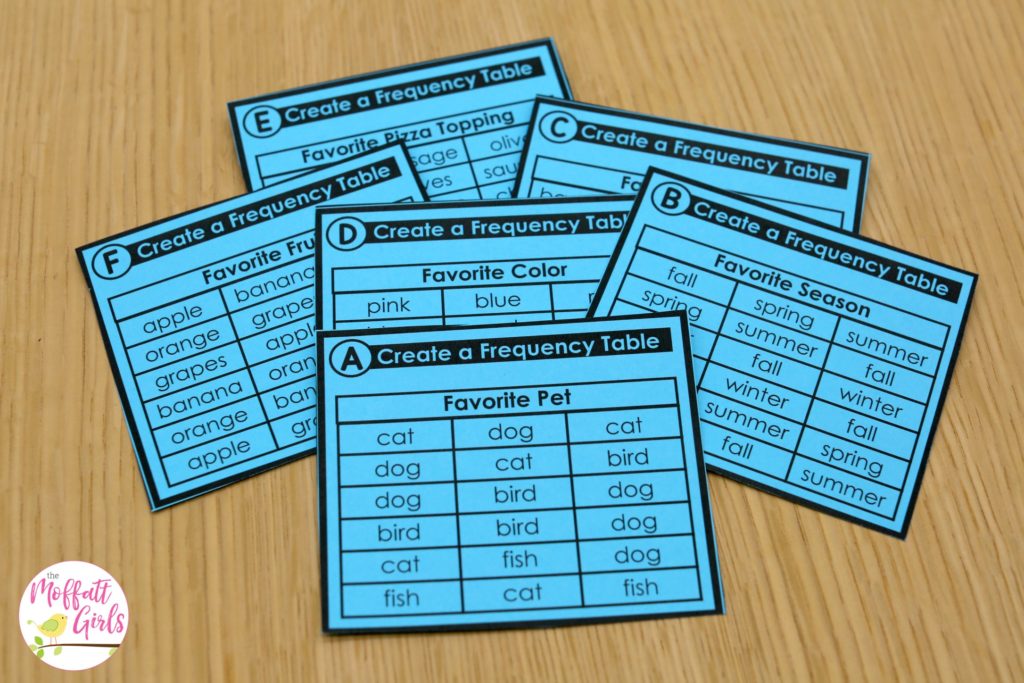
Center 1: Create a Frequency Table
Flip a card. Use the information on the card to create a frequency table.
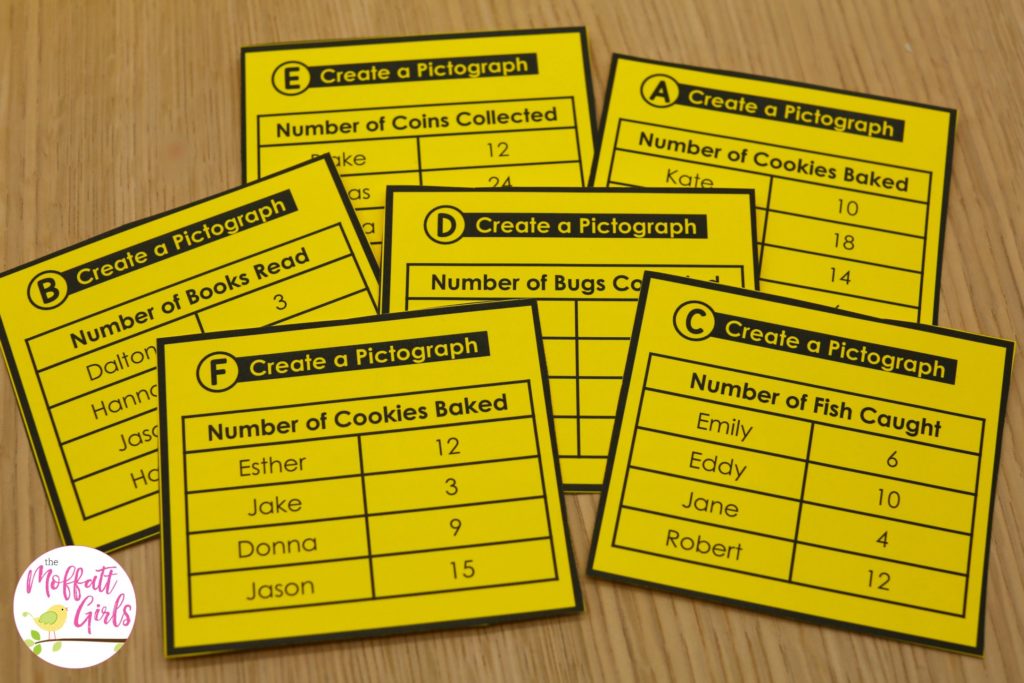
Center 2: Create a Pictograph
Pick a card and read the table. Use the information on the table to create a pictograph on the recording sheet.
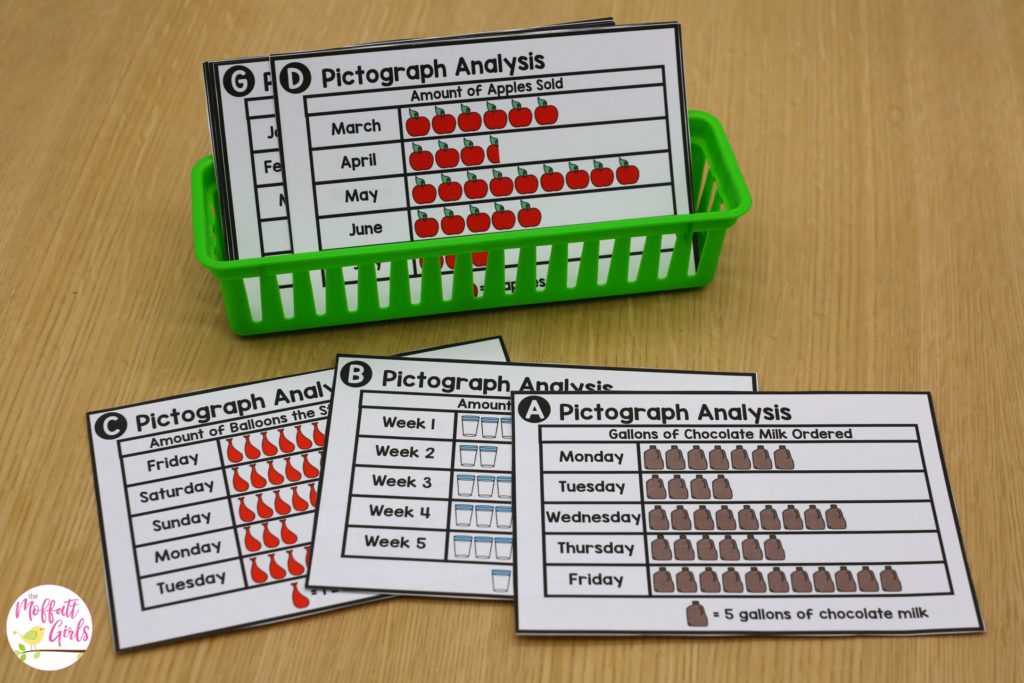
Center 3: Pictograph Analysis
Pick a card. Use the data on the pictograph to answer the questions on the recording sheet.
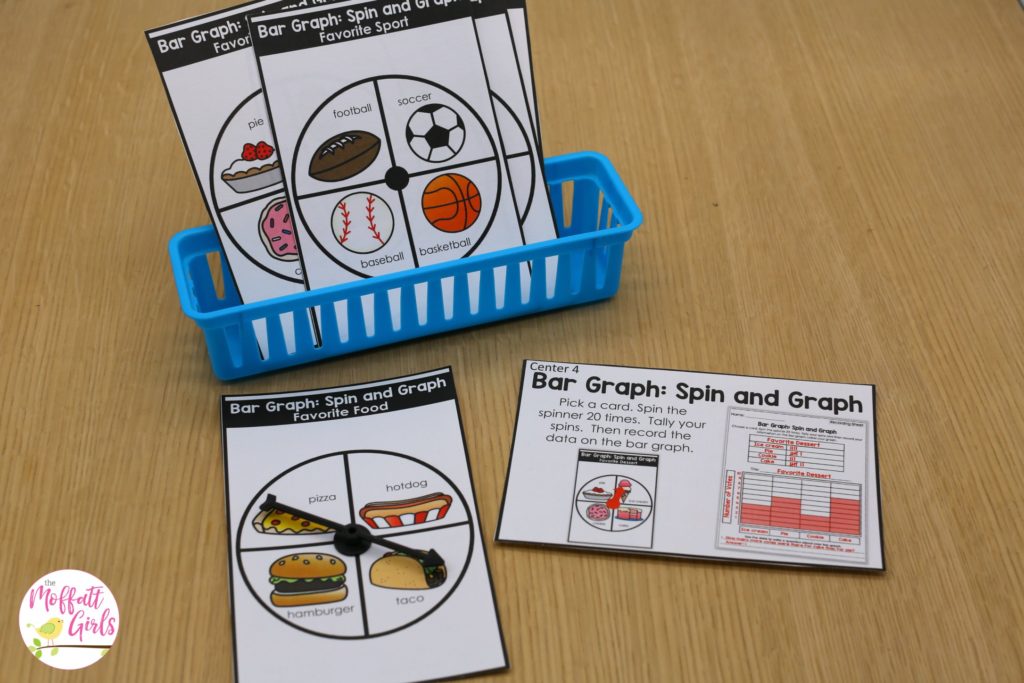
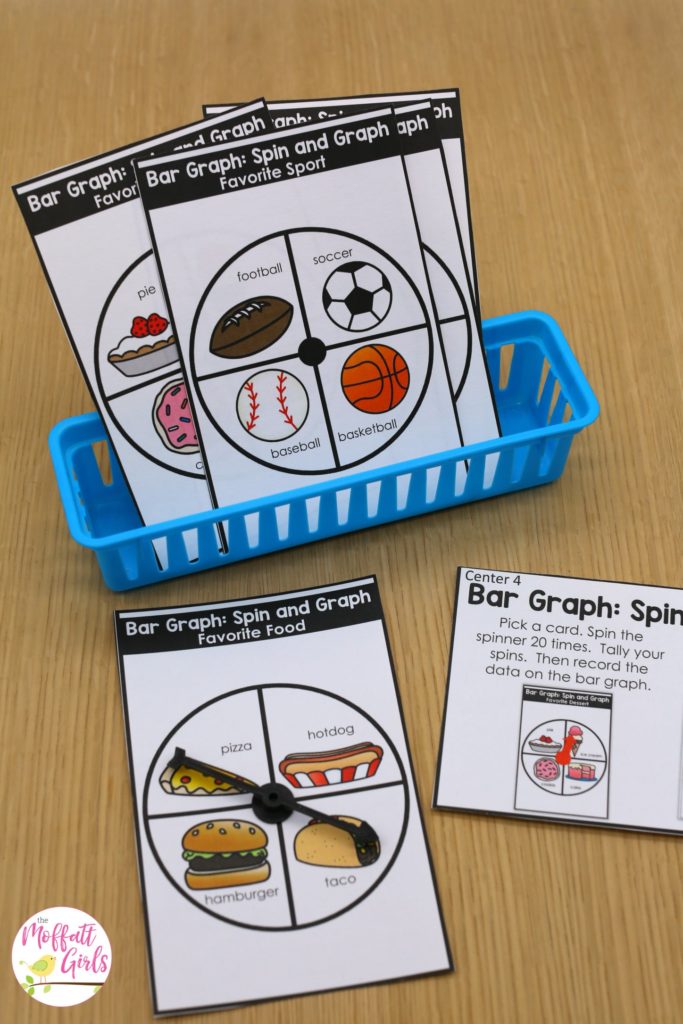
Center 4: Bar Graph (Spin and Graph)
Pick a card. Spin the spinner 20 times. Tally your spins. Then record the data on the bar graph.
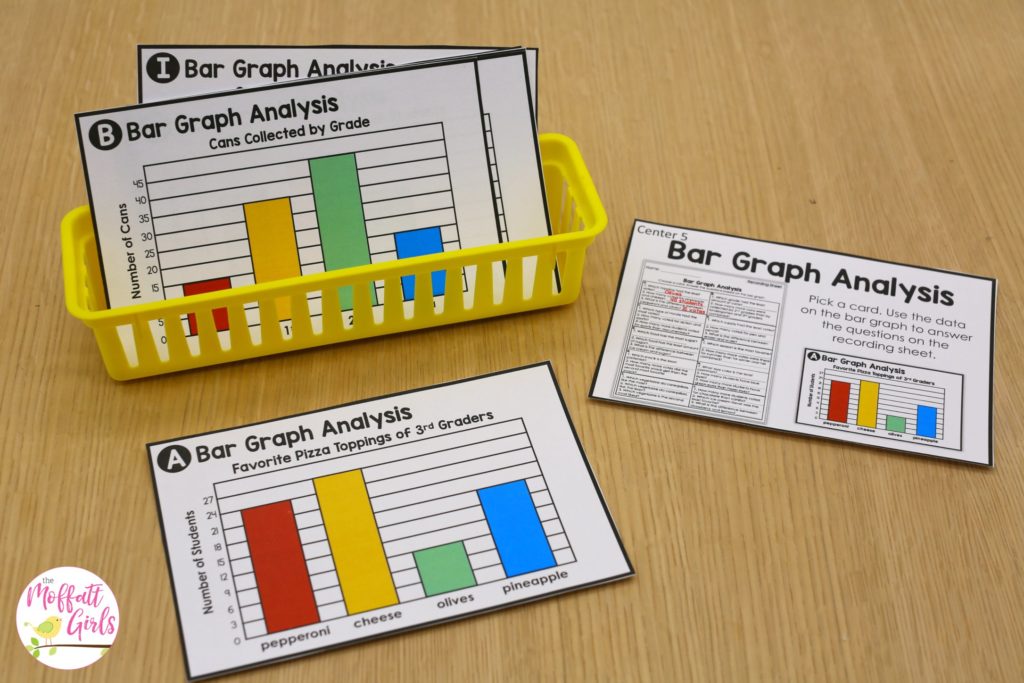
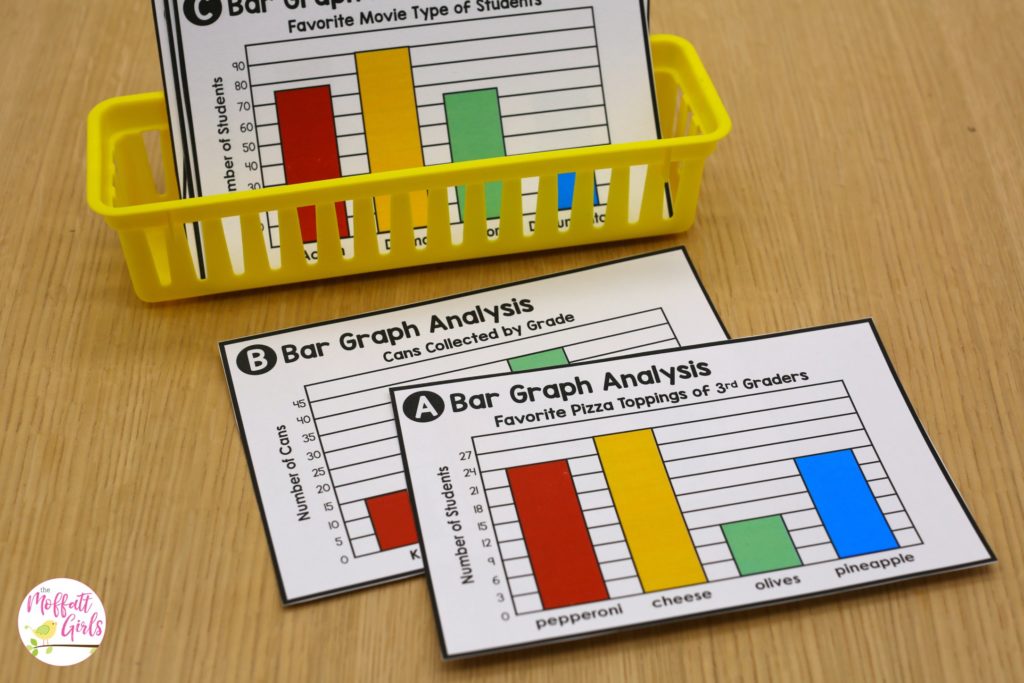
Center 5: Bar Graph Analysis
Pick a card. Use the data on the bar graph to answer the questions on the recording sheet.
Center 6: Roll and Graph
Roll a die 25 times. Graph the data. Then answer the questions on the recording sheet.
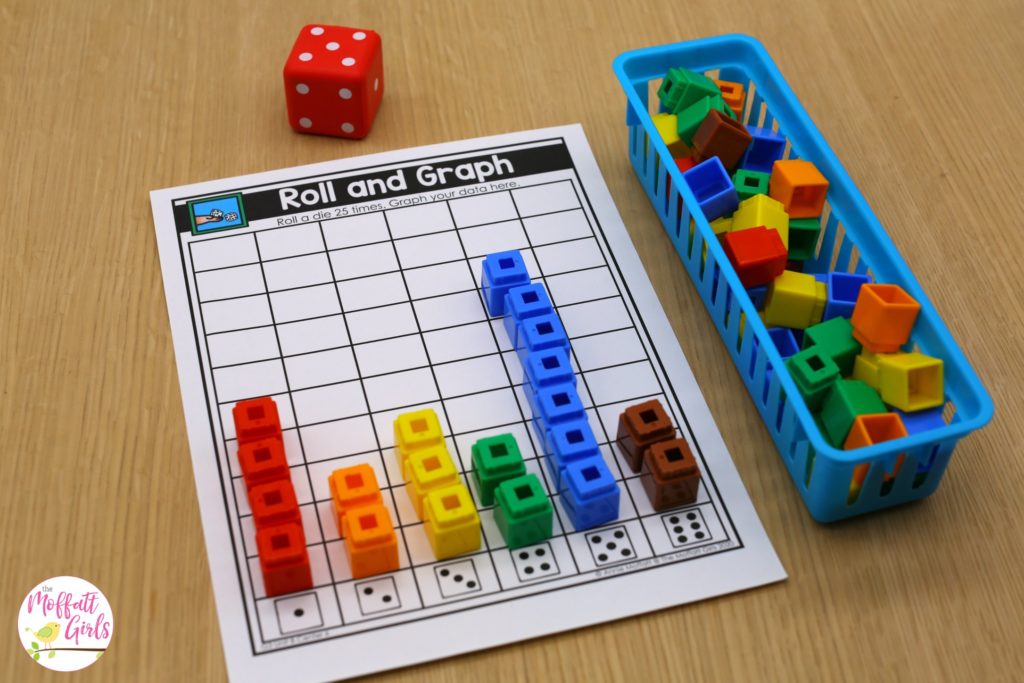
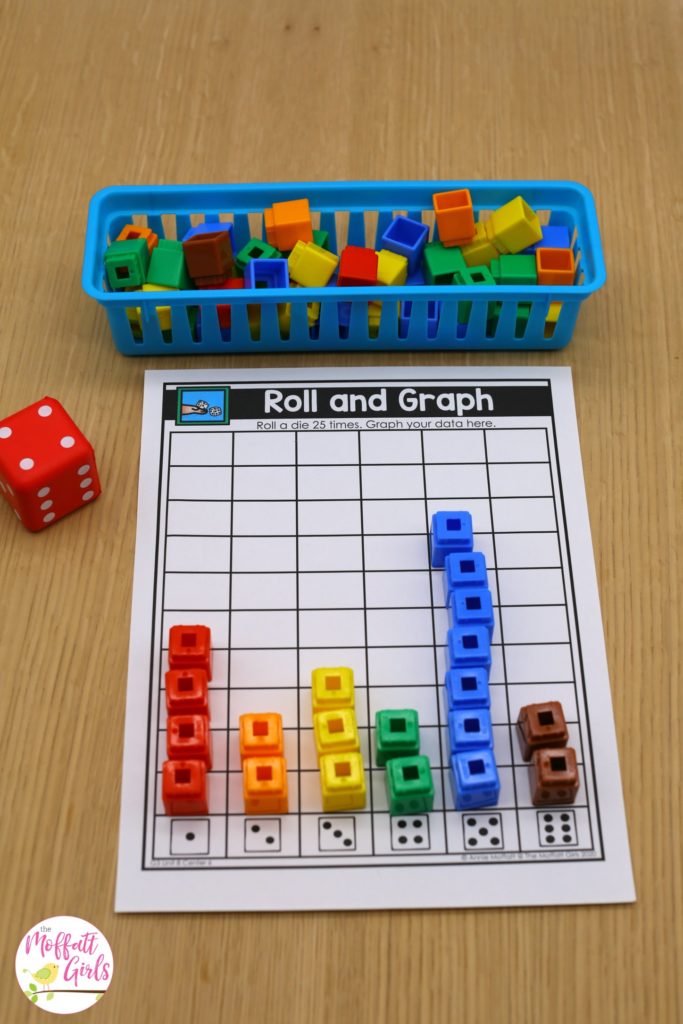
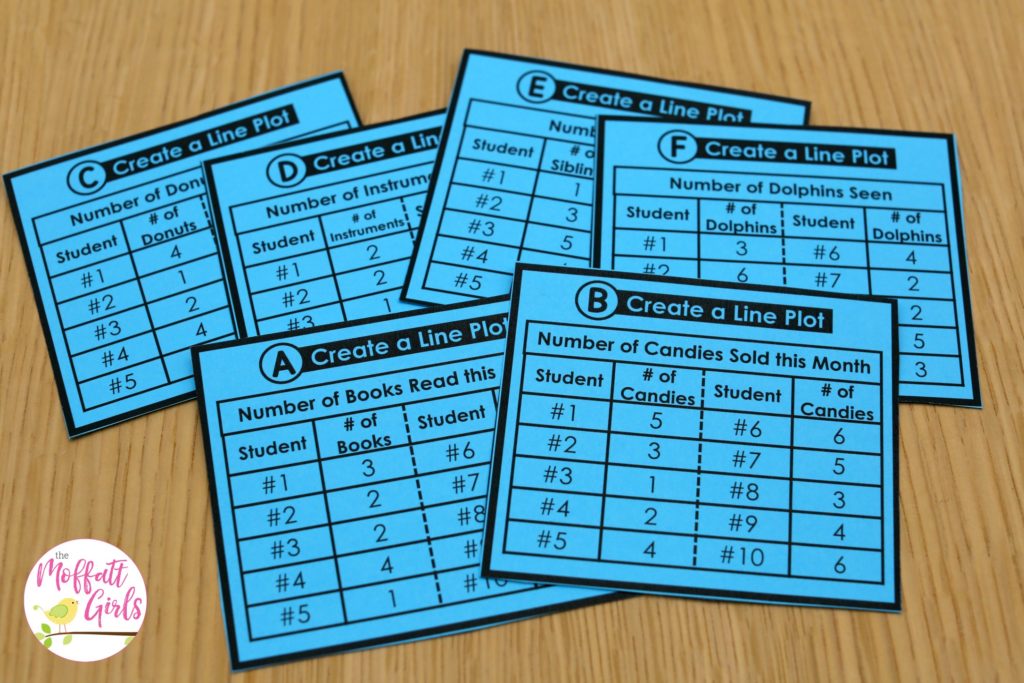
Center 7: Create a Line Plot
Flip a card. Record the data from the table on the line plot.
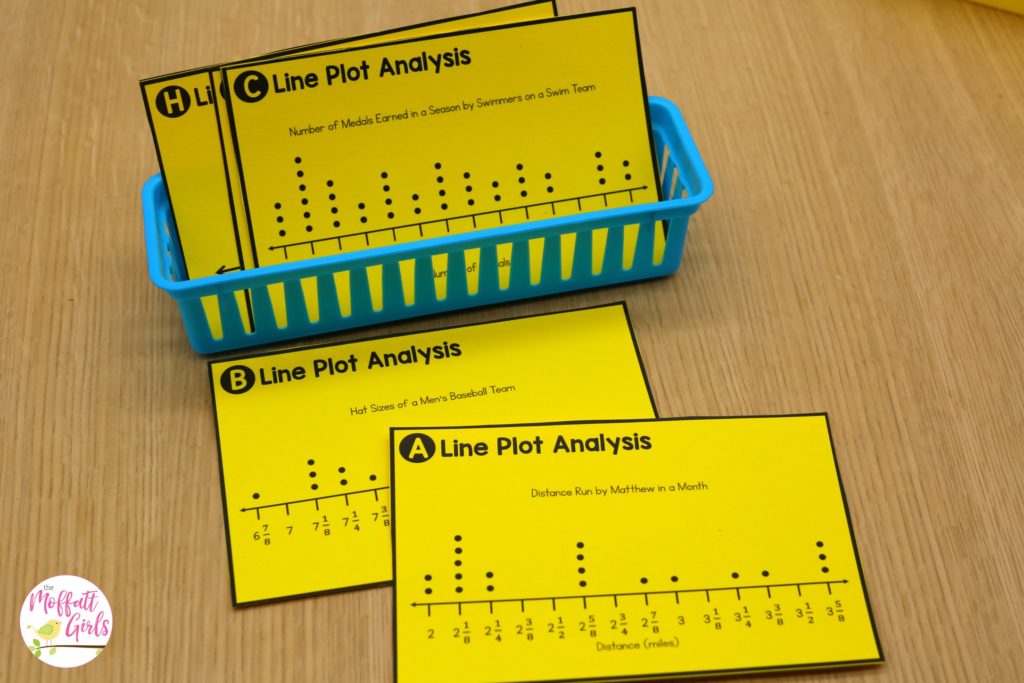
Center 8: Line Plot Analysis
Pick a card. Use the data on the line plot to answer the questions on the recording sheet.
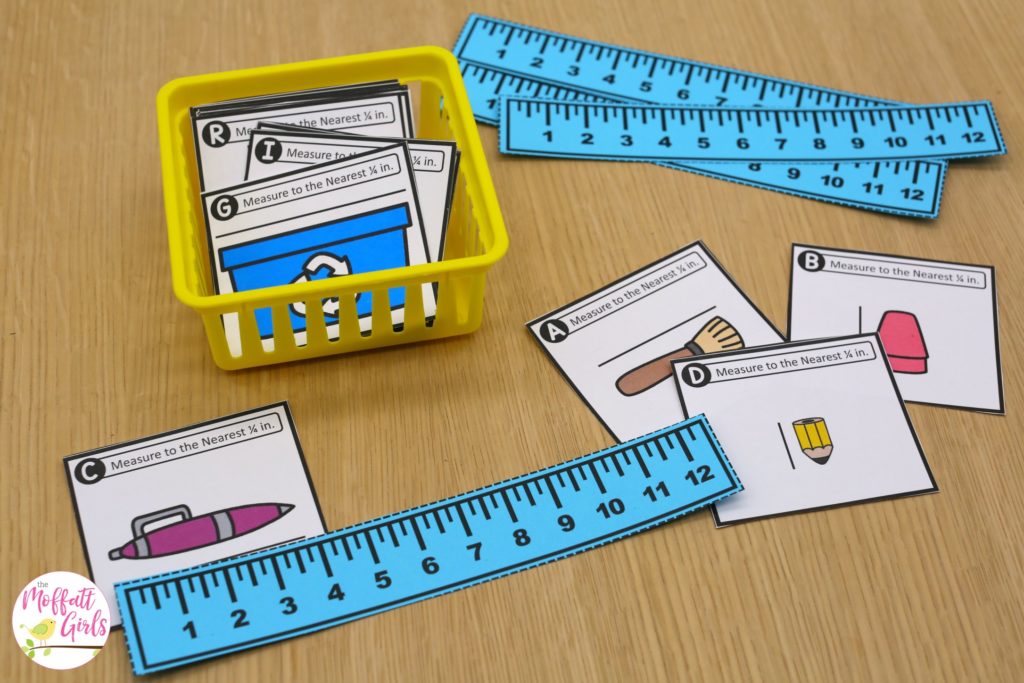
Center 9: Measure to the Nearest ¼ inch
Use a ruler to measure the items to the nearest ¼ inch. Record the measurements on the recording sheet.
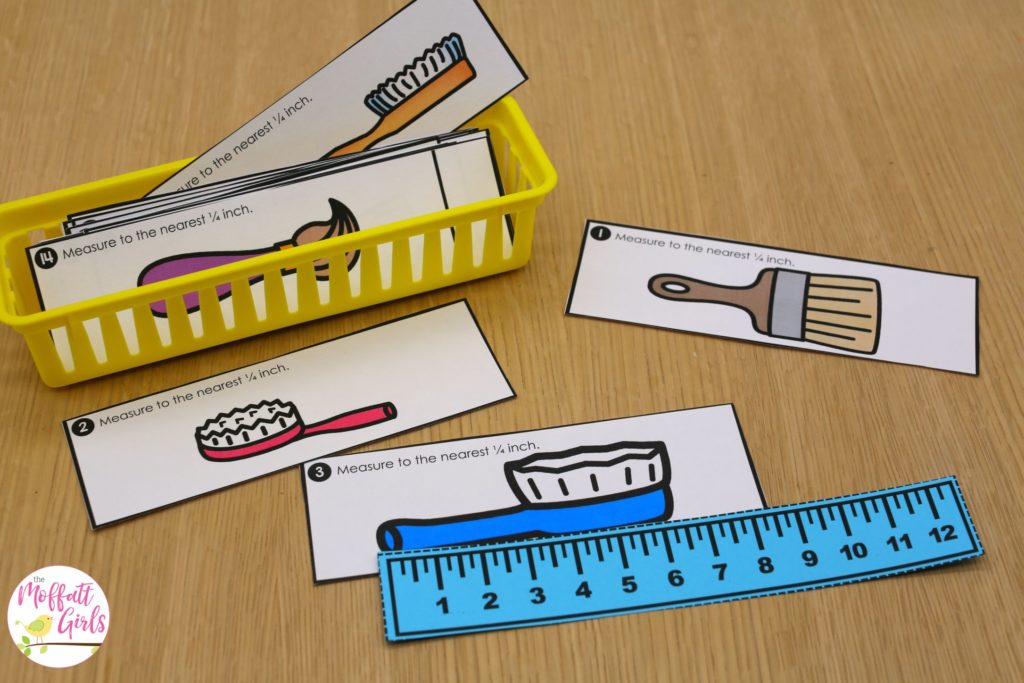
Center 10: Measure and Make a Line Plot
Use a ruler to measure the items to the nearest ¼ inch. Record the measurements. Then use the data to create a line plot.
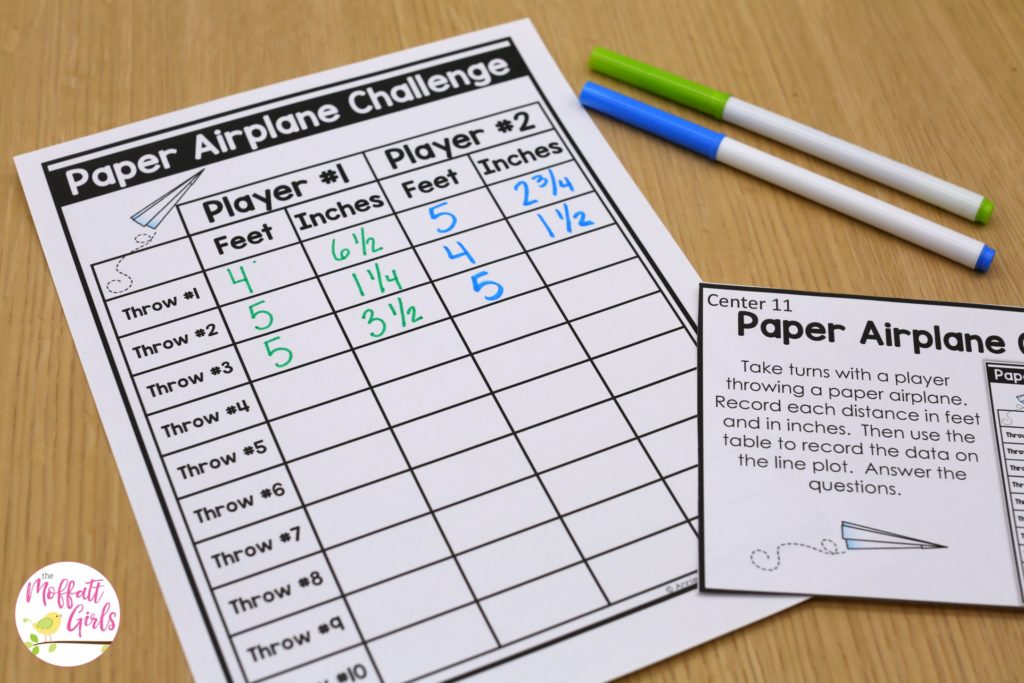
Center 11: Paper Airplane Challenge
Take turns with a player throwing a paper airplane. Record each distance to the nearest ¼ inch, using feet and inches. Then use the table to record the data on the line plot. Answer the questions.
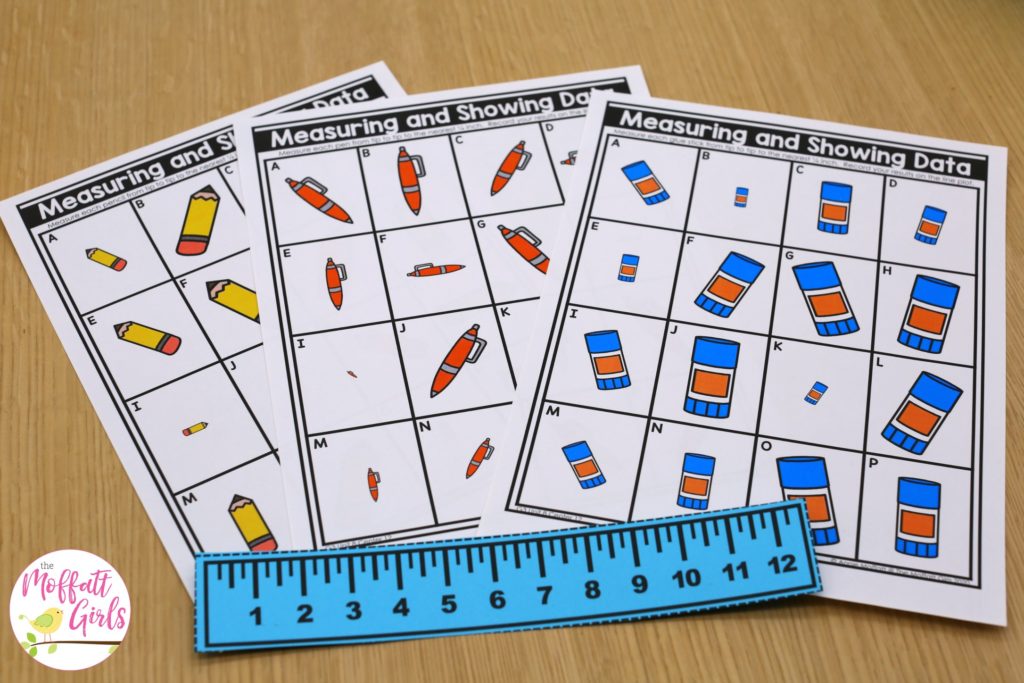
Center 12: Measuring and Showing Data
Use the ruler on the recording sheet to measure the pencils to the nearest ¼ inch. Plot them on the line plot. Then answer the questions.
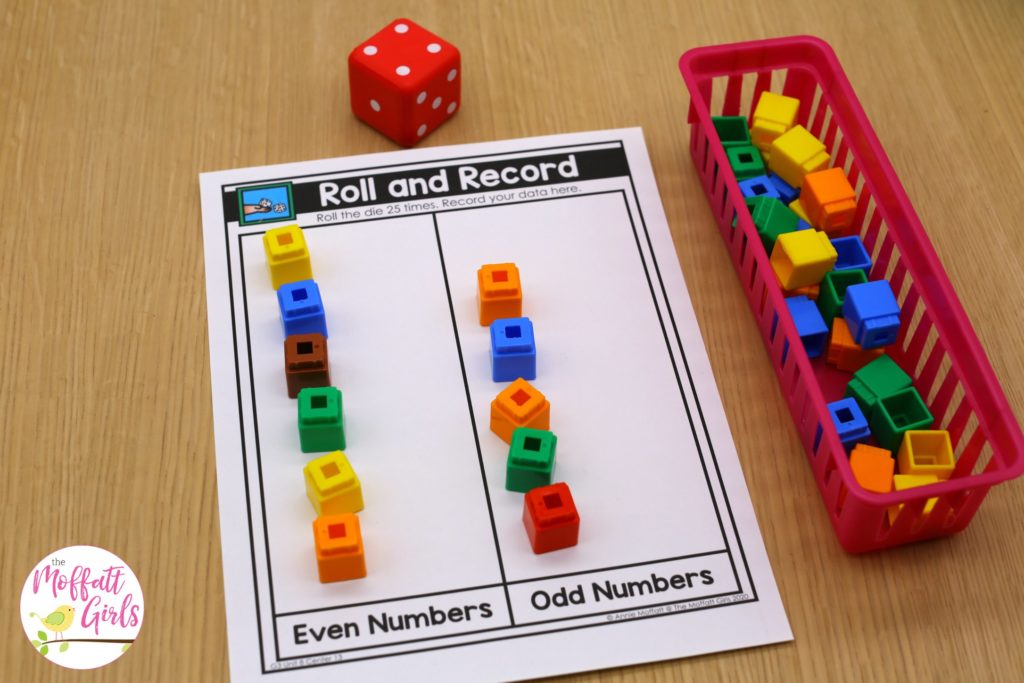
Center 13: Roll and Record
Roll a die 20 times. Count each even and odd roll. Graph Your results and write three questions.
These no-prep practice pages are convenient and will help students master the skills needed for a more in-depth understanding of time. For each page, there is a grade-level standard attached so you know EXACTLY what you are covering! You can feel confident that ALL the standards for Third Grade are being covered!
HOW DO I ORGANIZE THE UNITS?
I chose to store the math centers in Sterilite bins because they don’t take up too much space. It is a tight fit, but I find that they work nicely for me. However, if you choose, you could store the centers in a larger container as well. Within the bin, each math center is stored in a gallon-sized ziplock baggie.
You can purchase Unit 8 individually HERE or
SAVE BIG WITH THE BUNDLE HERE




I noticed the price on your purchase page is $8 an not the $5 as listed here on your blog. I’m just giving you a heads up so that you can update your blog price as well.
I’m sorry, I realized I hit the little arrow buttons and posted this to the wrong blog post. It was meant for the 3 weeks no prep learning packets.
Amazing resources.Thank you so much!