Teaching graphs and data to second grade students combines previously-learned math concepts with making sense of and organizing the information of everyday statistics. Furthermore, it allows them to communicate their reasoning and mathematical thinking. When students become comfortable and efficient in understanding and using graphs, they are eventually able to apply these skills to more complex data analysis.
Unit 6 focuses on teaching second grade students how to use tally charts, line plots, bar graphs, pictographs, and pie charts.
In this math unit on Data and Graphing, students will learn to:
* Generate measurement data by measuring lengths of several objects to the nearest whole unit, or by making repeated measurements of the same object.
* Show the measurements by making a line plot, where the horizontal scale is marked off in whole-number units.
* Draw a picture graph and a bar graph (with single-unit scale) to represent a data set with up to four categories.
* Solve simple put-together, take-apart, and compare problems using information presented in a bar graph .
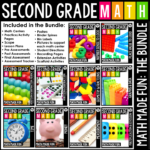
SAVE $$$ WITH THE BUNDLE!
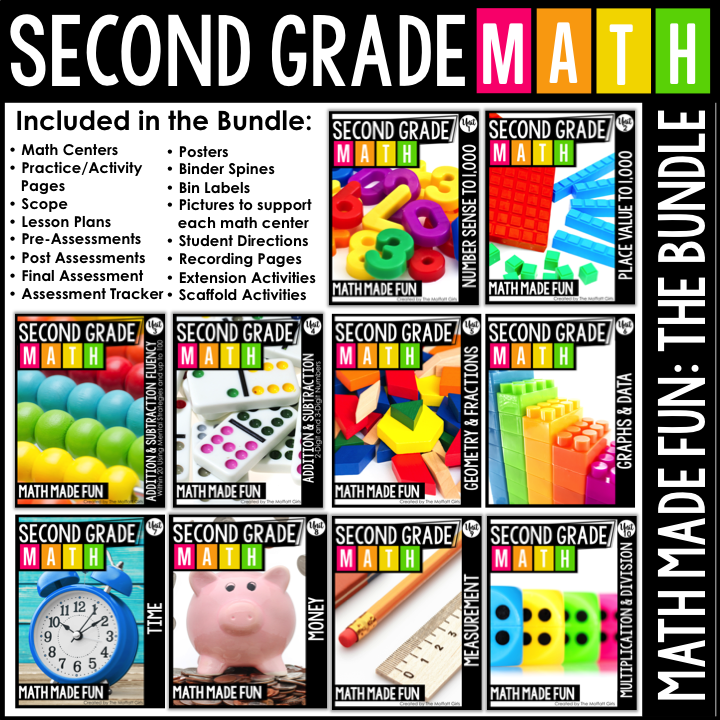
ALL 10 UNITS INCLUDED!
Here are the 10 Units that will be included in the 2nd Grade: Math Made Fun Curriculum
Unit 1: Number Sense to 1,000
Unit 2: Place Value to 1,000
Unit 3: Addition and Subtraction Fluency within 100
Unit 4: Addition and Subtraction with 2-Digit and 3-Digit Numbers
Unit 5: Geometry and Fractions
Unit 6: Graphs and Data
Unit 7: Time
Unit 8: Money
Unit 9: Measurement
Unit 10: Multiplication and Division
This 2nd Grade Math Made Fun Unit 5 has 13 hands-on math centers and 49 NO PREP/Activity pages!
Each unit includes a scope with the objectives:
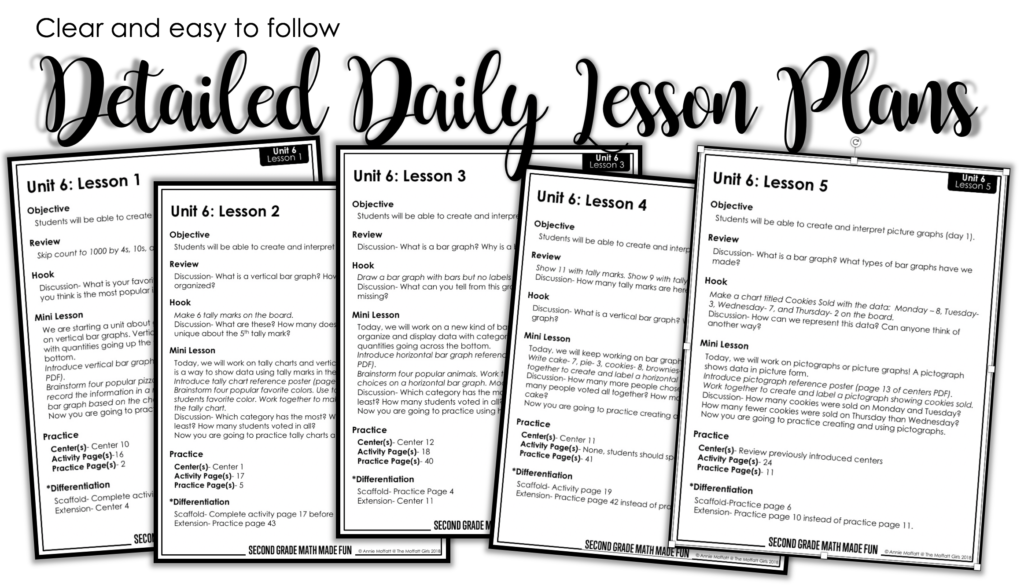
The Daily Lesson Plans offer differentiation for on-level, below-level and above-level students.
The lesson plans are broken down into 5 easy-to-follow parts:
1. Objective– What students should be able to do by the end of the lesson.
2. Review- A quick warm-up that has students practice previous skills that will be used in the current lesson.
3. Hook-A fun intro to get students engaged.
4. Mini Lesson– Teach, model, and discuss the new skill in today’s lesson.
5. Practice- Each practice section lists three types of activities that pair well with the specific lesson.
Center(s)- New center(s) to be introduced with the lesson.
Activity Pages- These pages require some basic materials such as scissors, glue or dice.
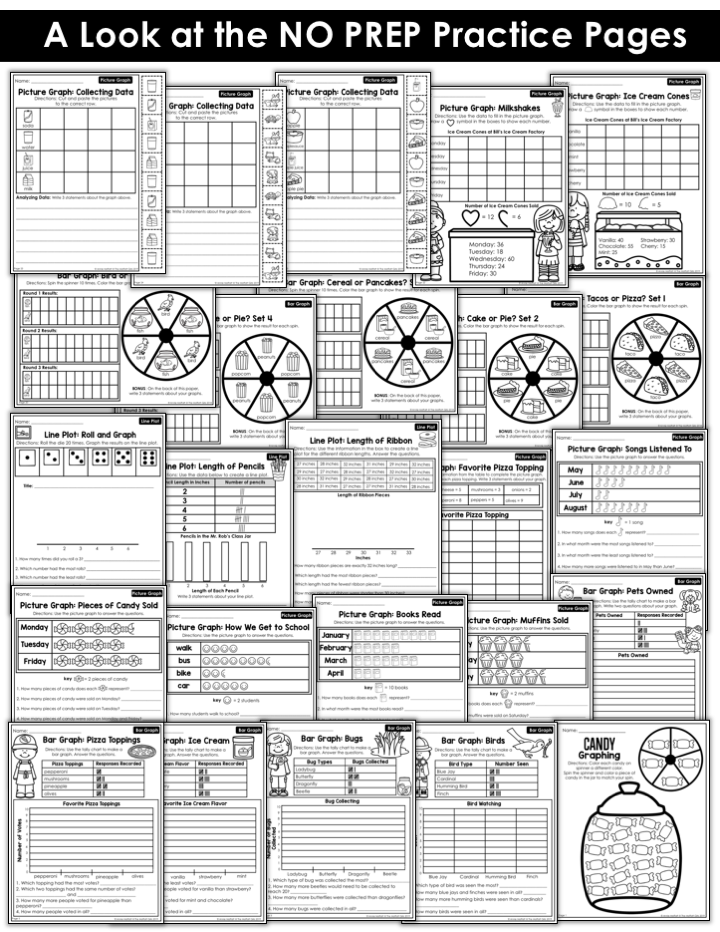
Practice Pages- These only require a pencil and crayons! They are great for table work, homework or work on the go!
✸Differentiation– Each lesson include scaffold and extension ides to meet the needs of students at all levels!
Pre and Post Assessments for EACH unit!

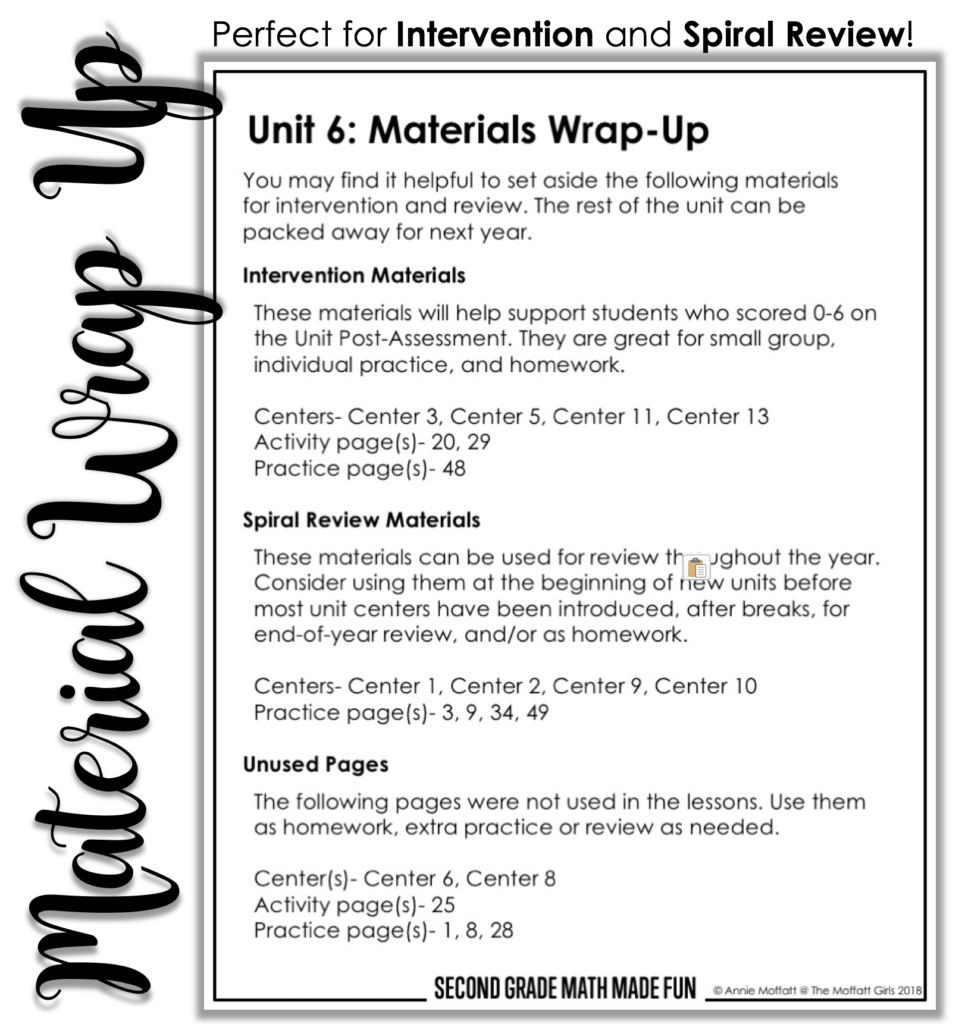
Material Wrap Up Page!
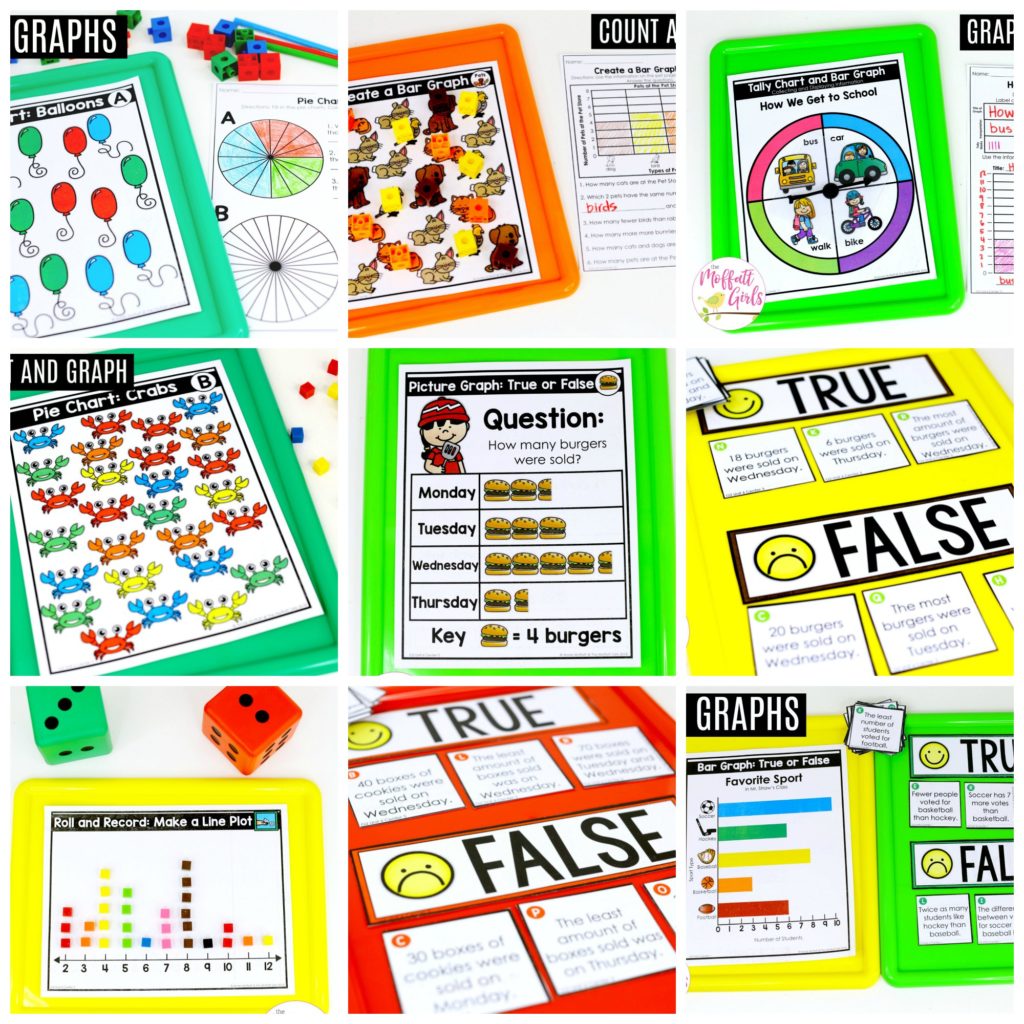
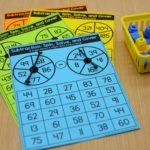
LET’S LOOK AT THE MATH CENTERS FOR UNIT 6 IN ACTION…
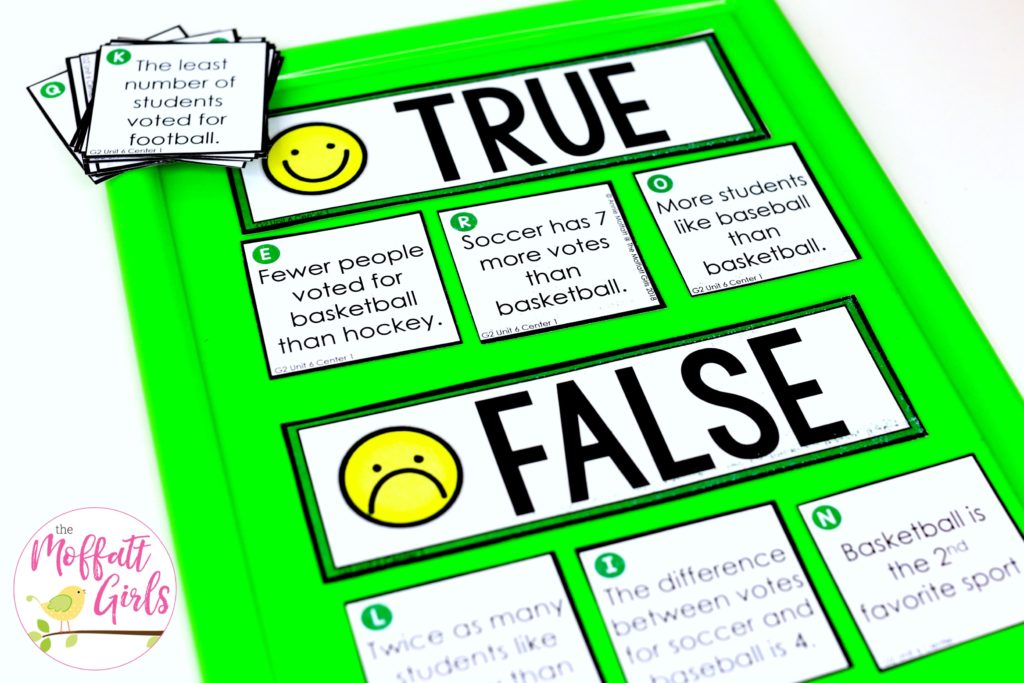
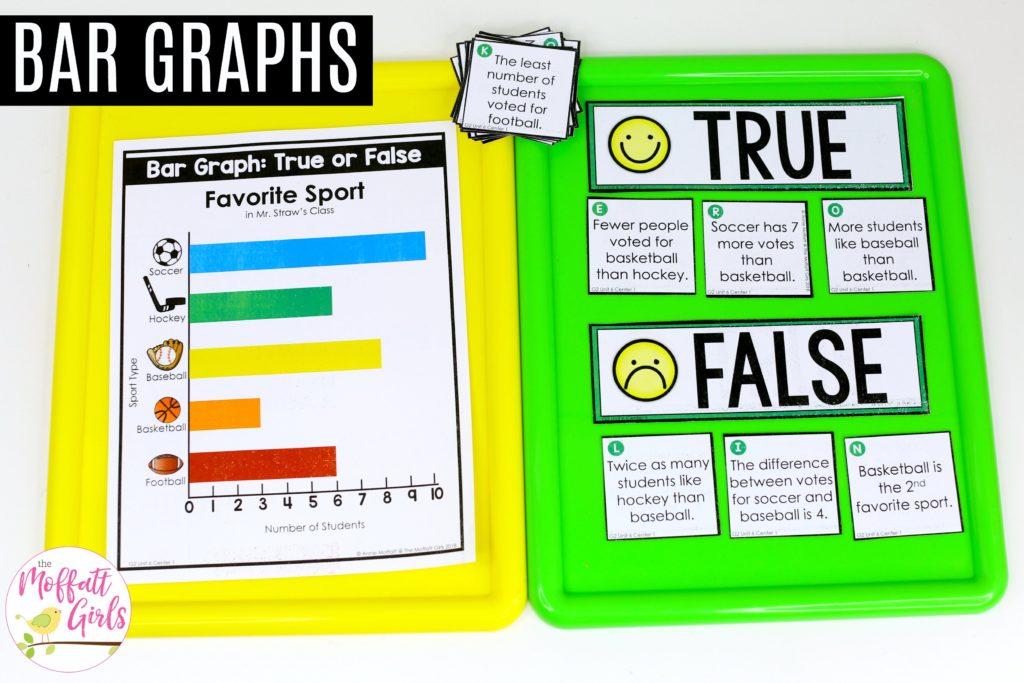
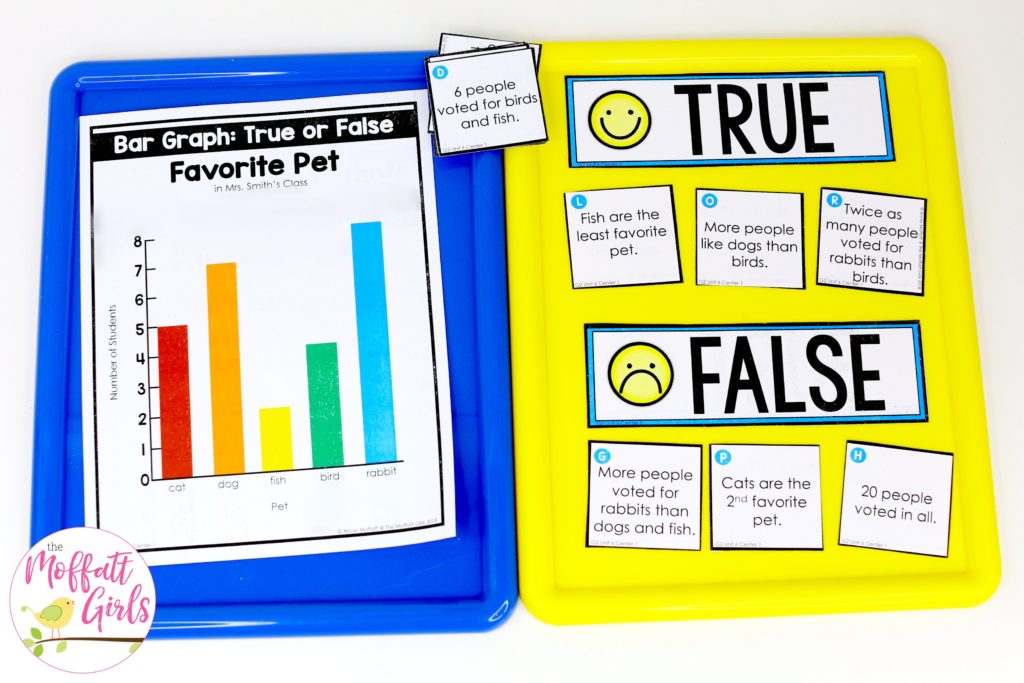
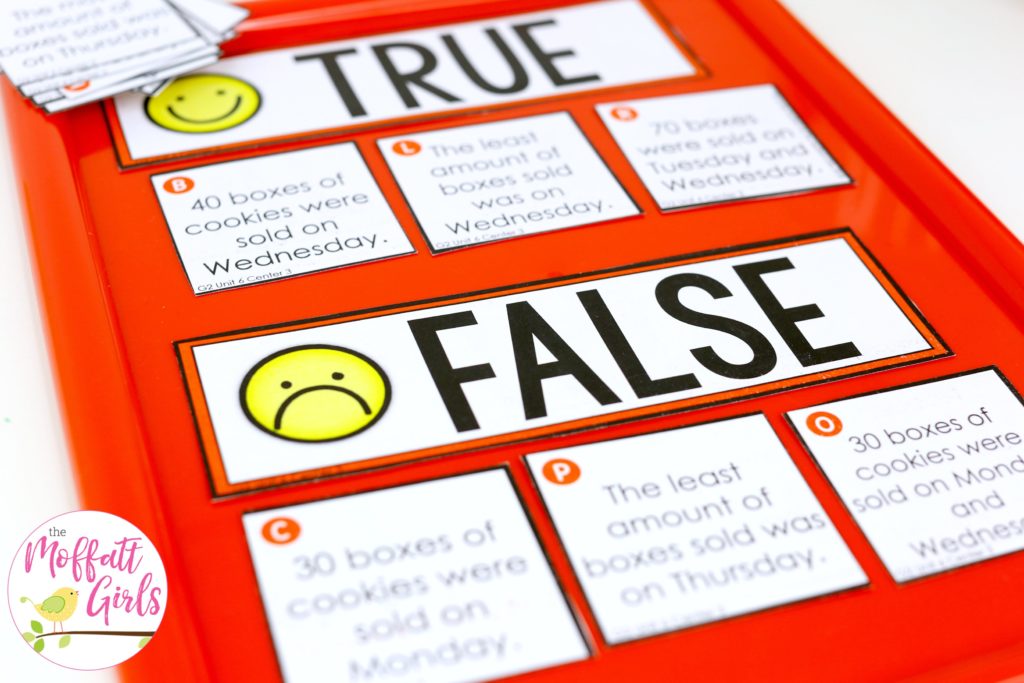
CENTER NUMBER 1: Bar Graph- True or False?
Flip a card and read the statement on the card. Look at the bar graph and decide if the card is true or false.
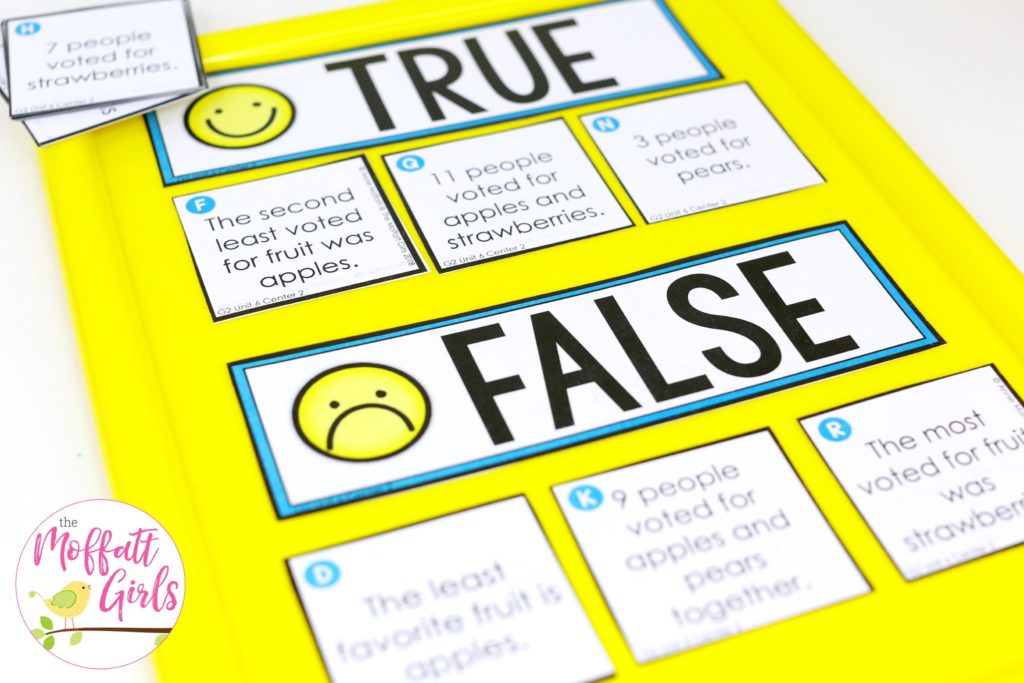
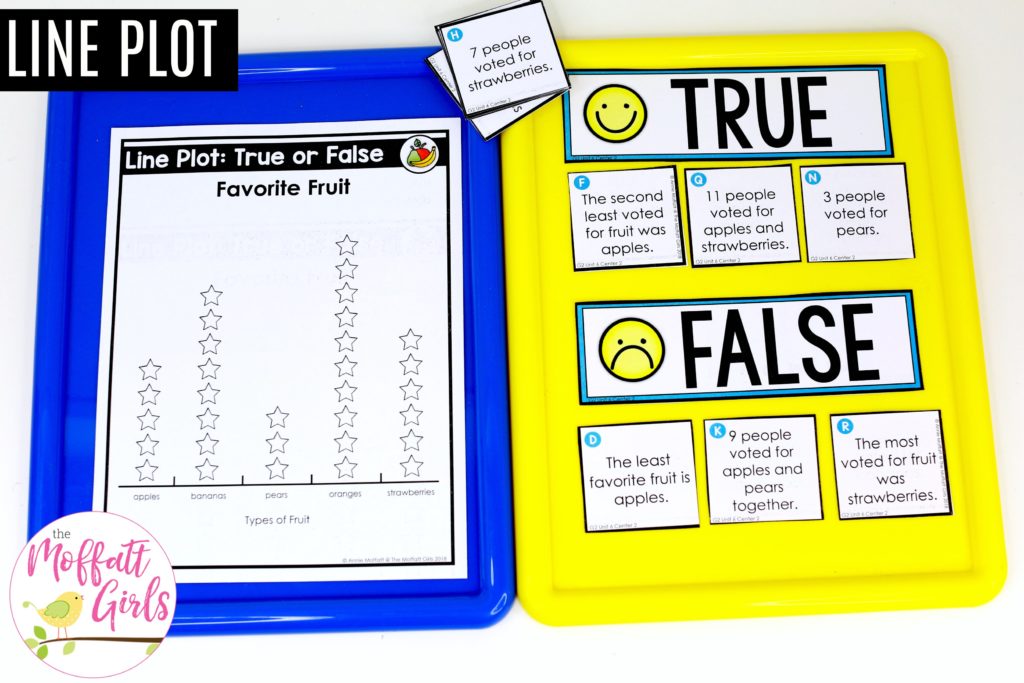
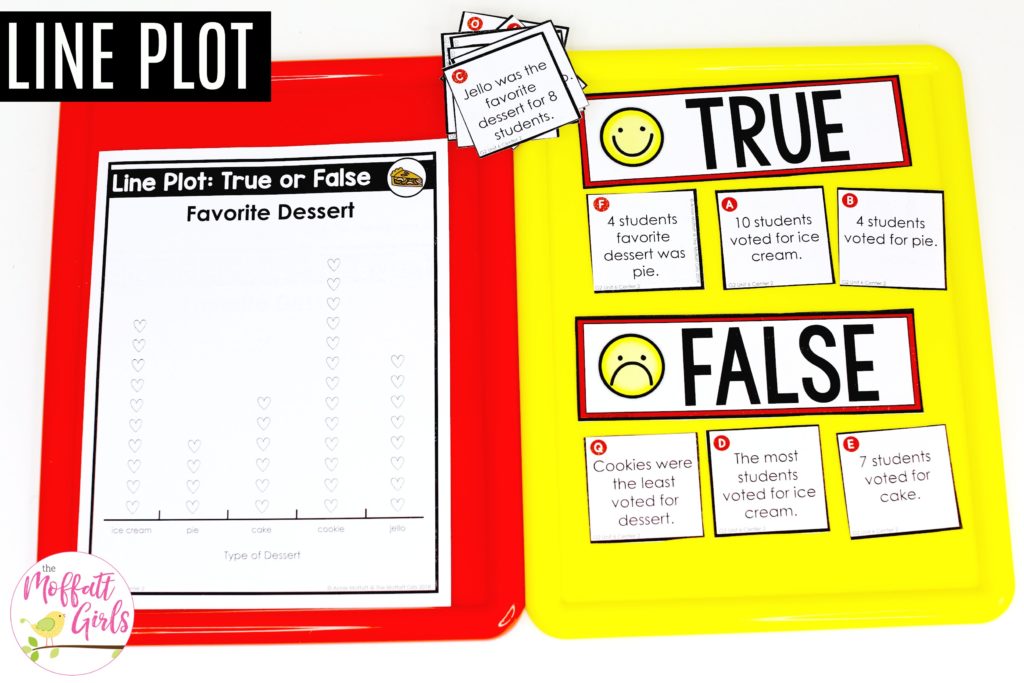
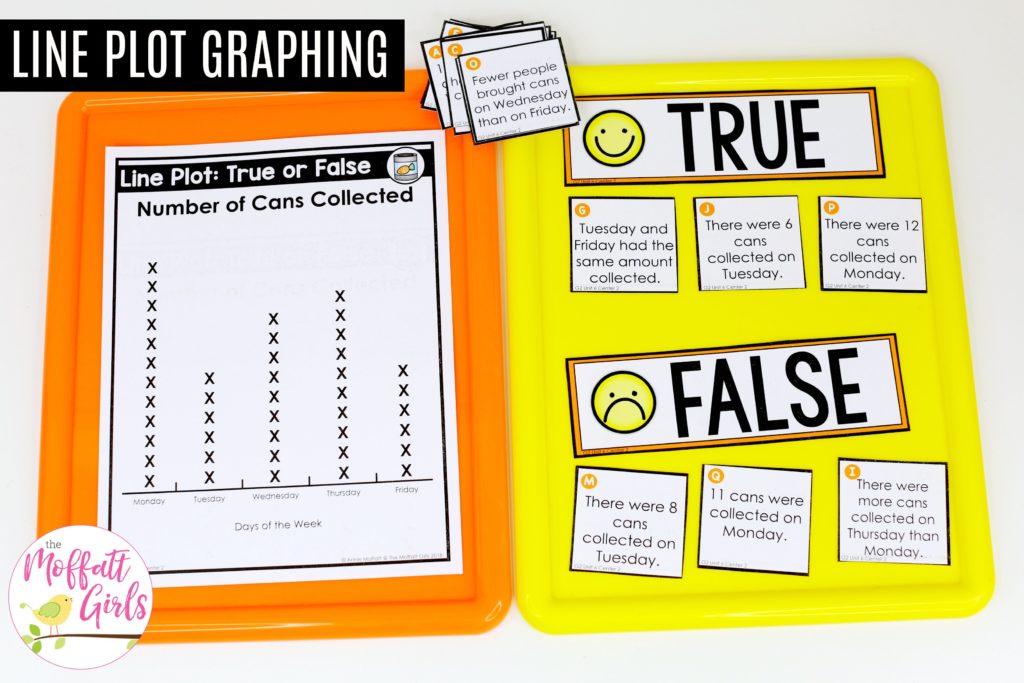
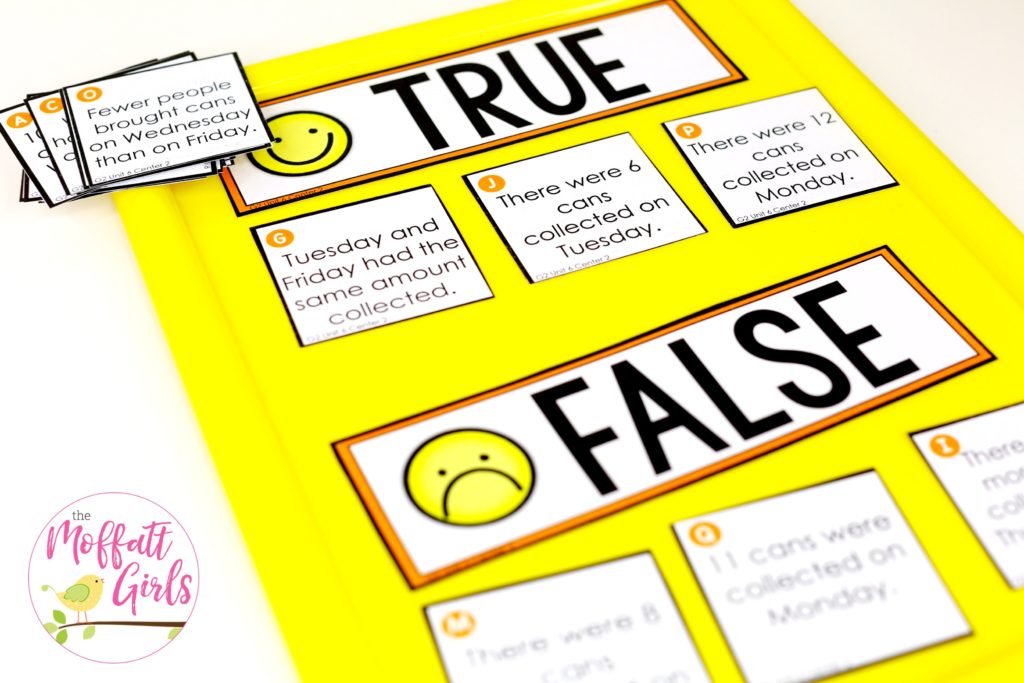
CENTER NUMBER 2: Line Bar- True or False?
Flip a card and read the statement on the card. Look at the line plot and decide if the card is true or false.
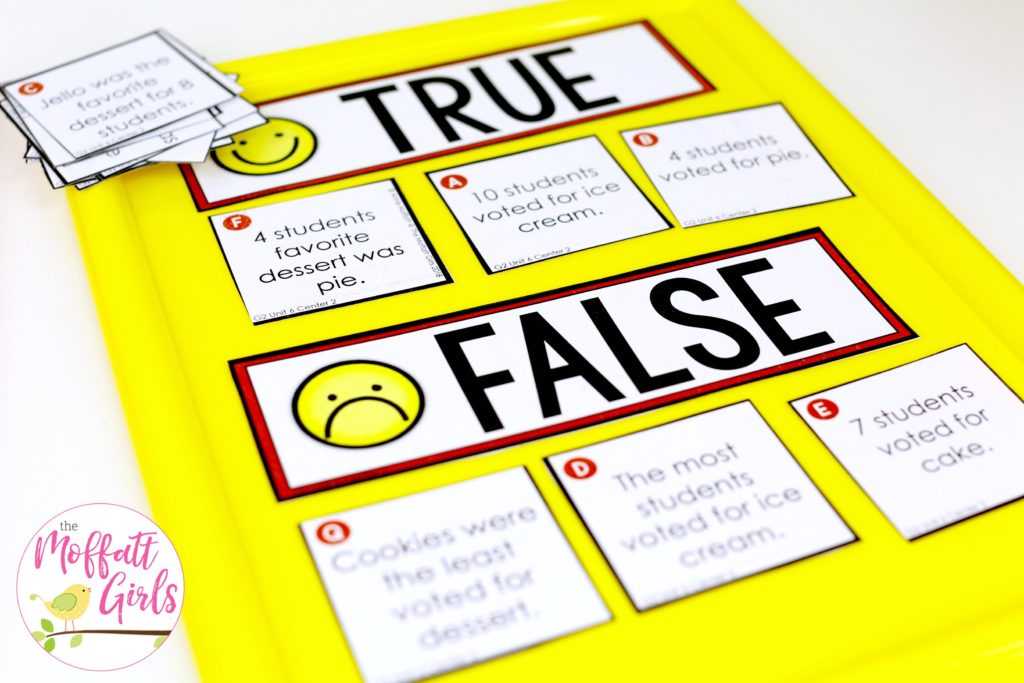
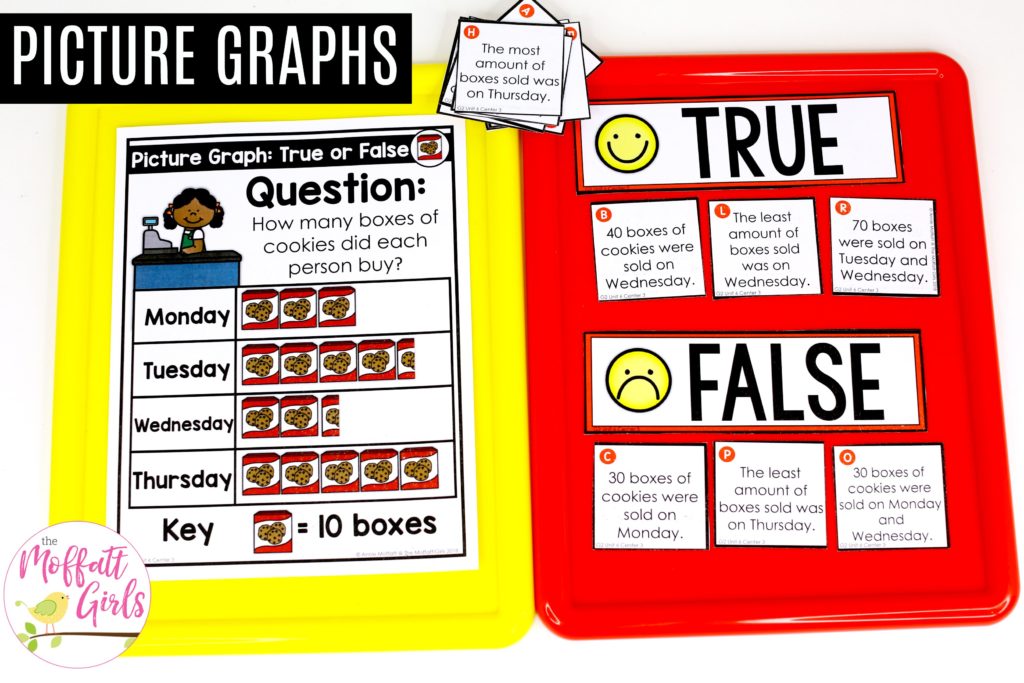
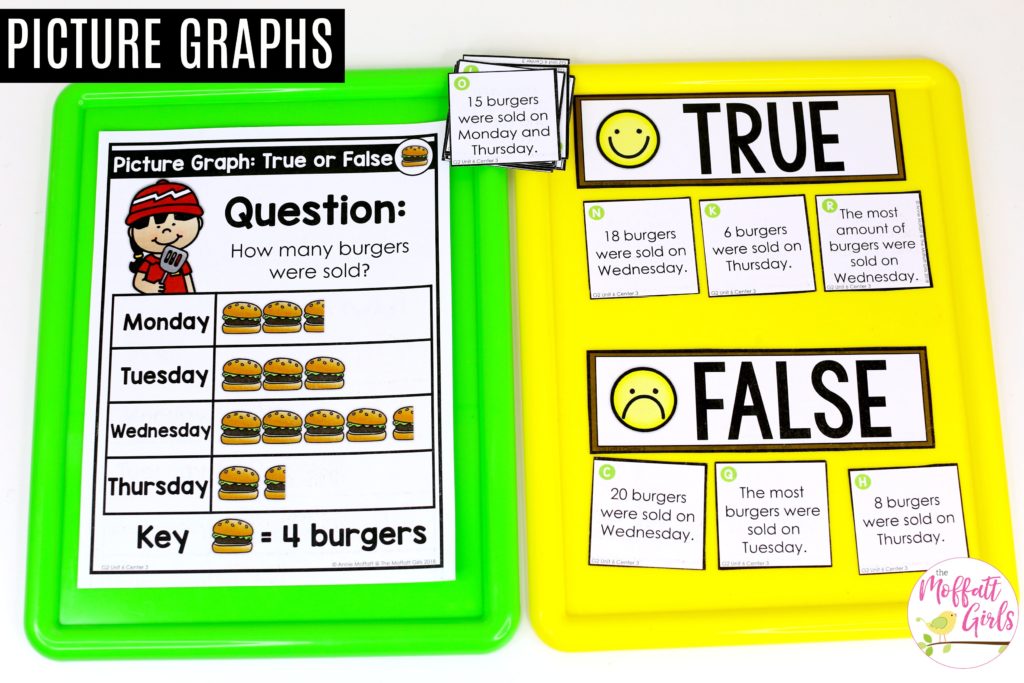
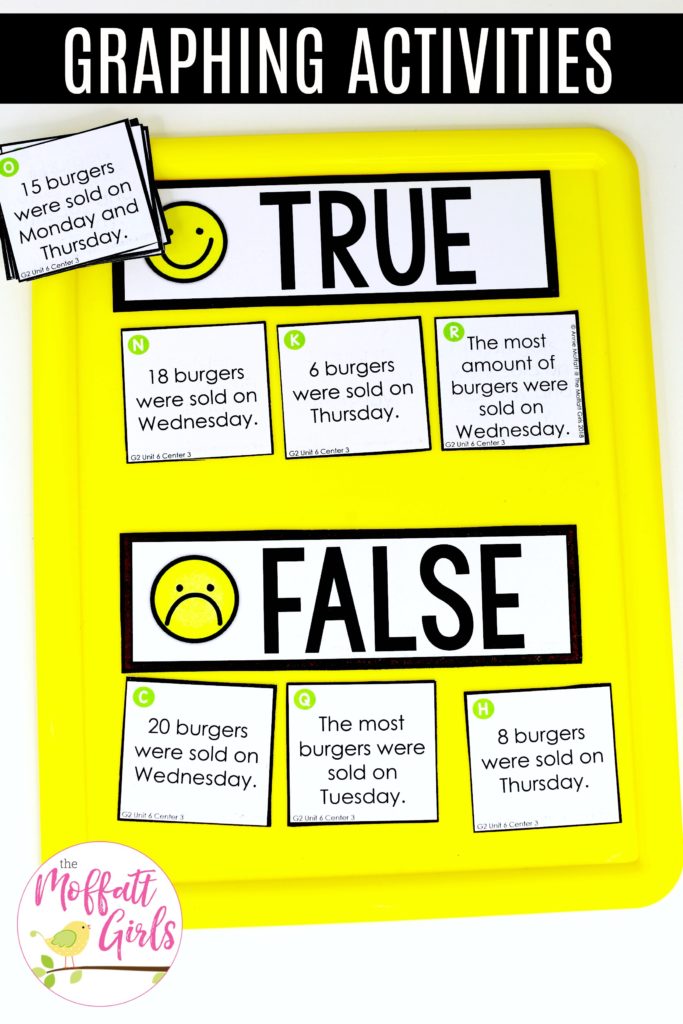
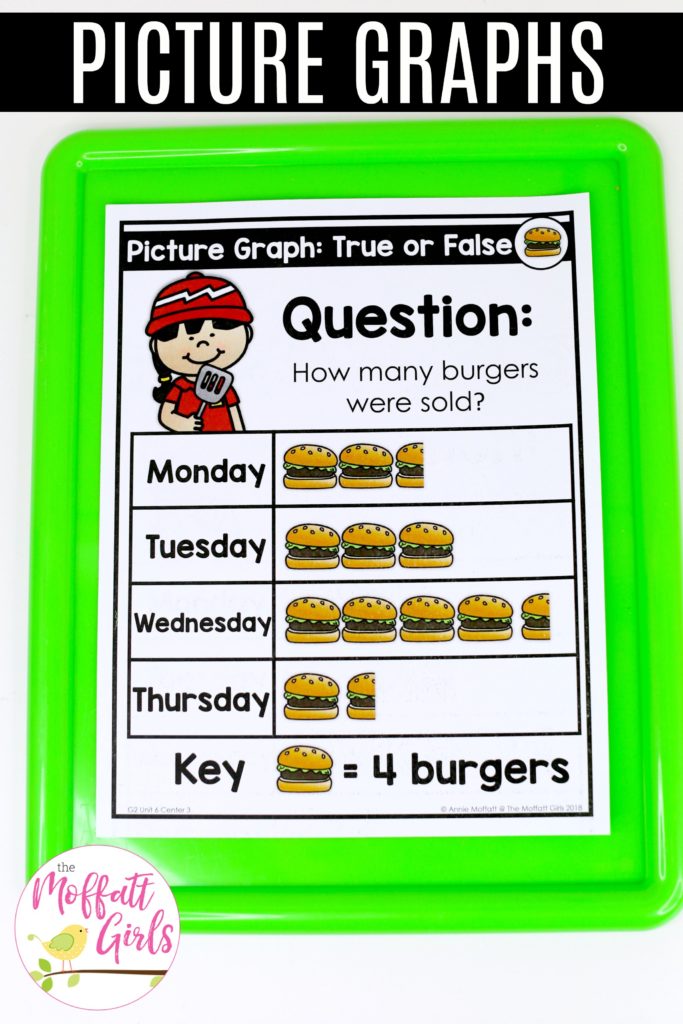
CENTER NUMBER 3: Picture Graph- True or False?
Flip a card and read the statement on the card. Look at the picture graph and decide if the card is true or false.
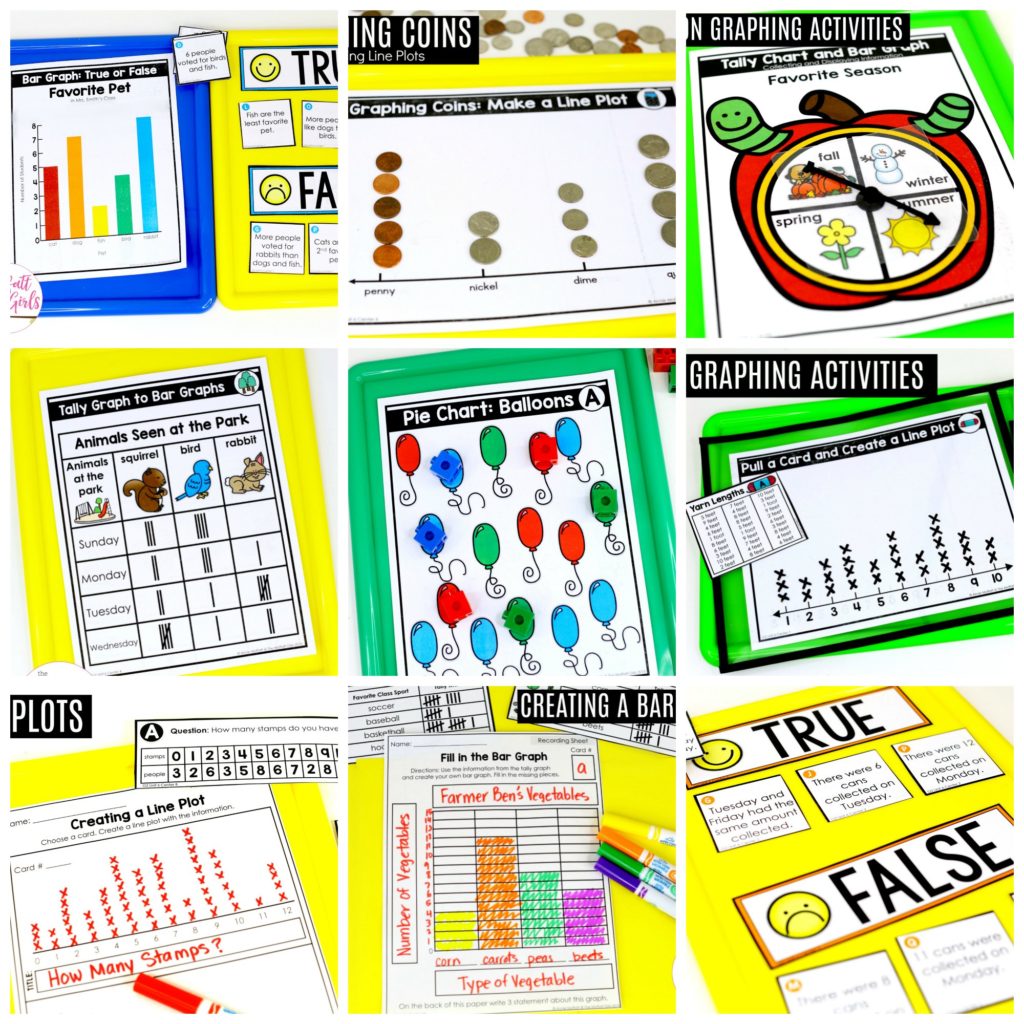
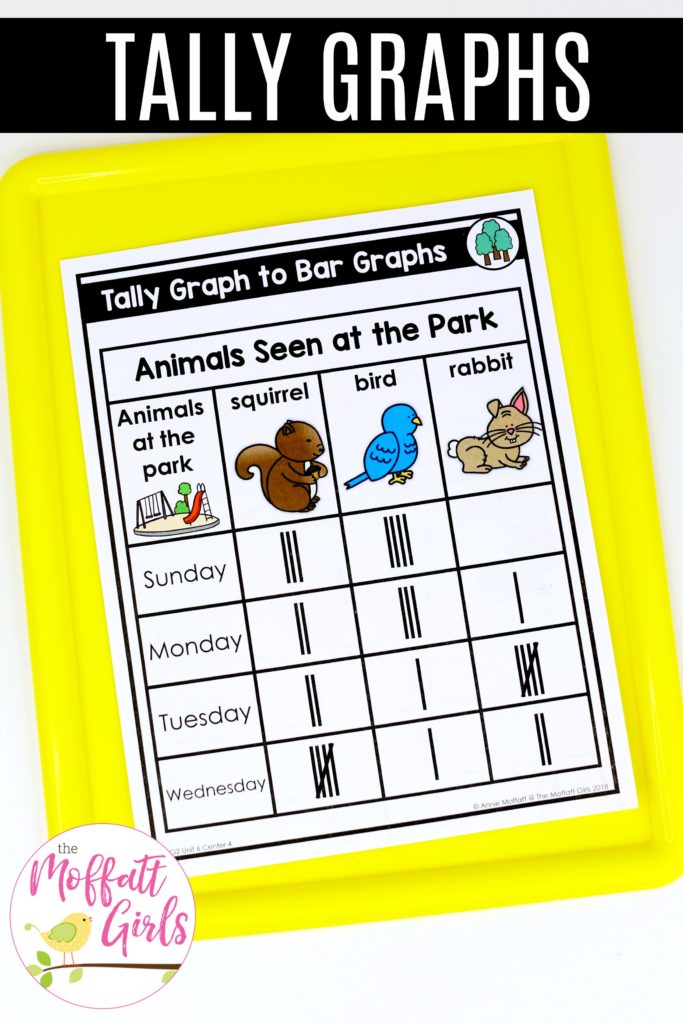
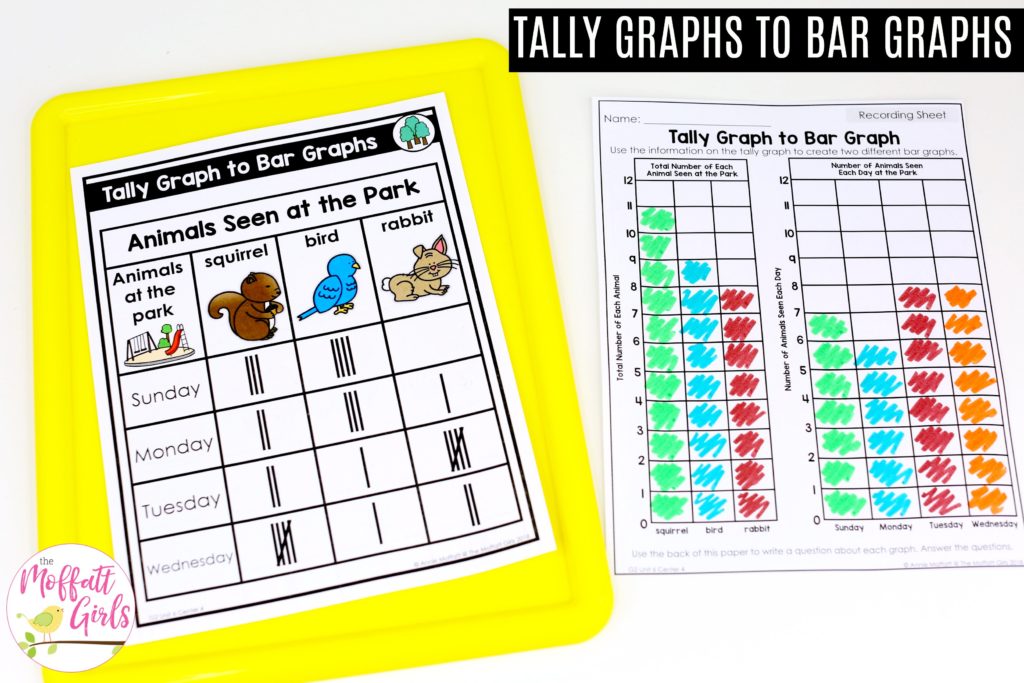
CENTER NUMBER 4: Tally Graph to Bar Graph
Read the tally graph. Use the information to create two different bar graphs on the recording sheet.
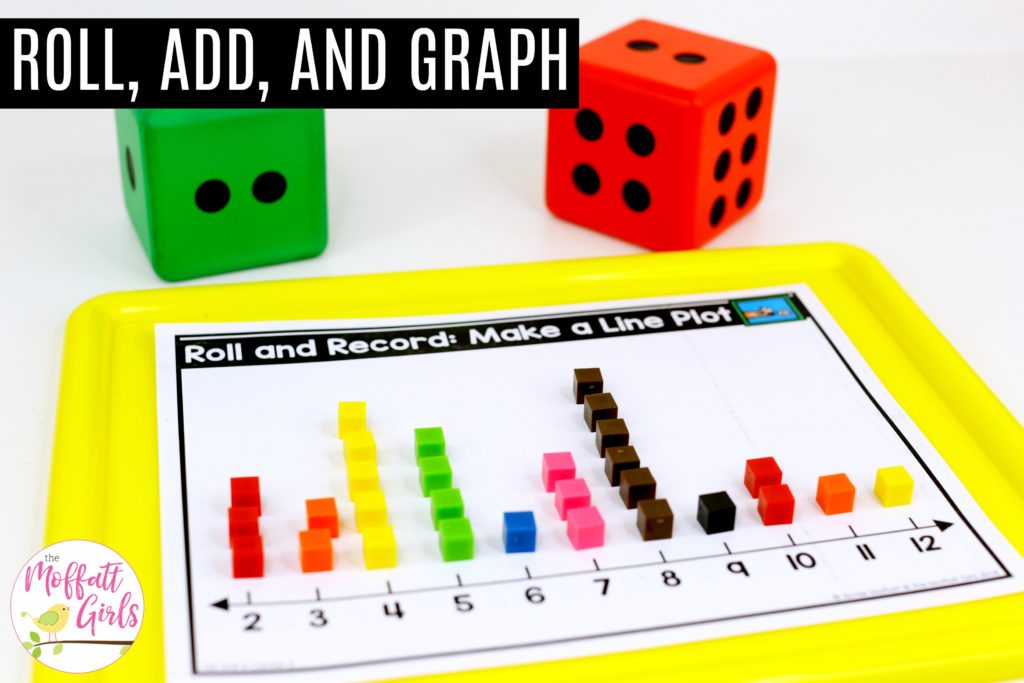
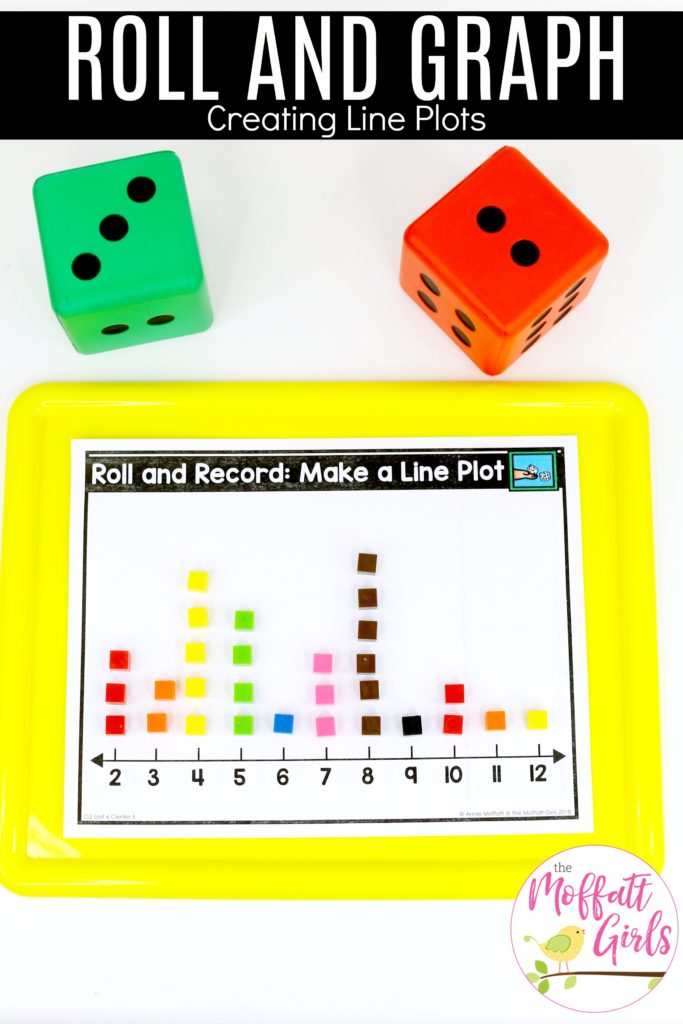
CENTER NUMBER 5: Roll and Record- Make a Line Plot
Roll two dice and add the numbers. Do this twelve times. Fill in the line plot. Answer the questions on the recording sheet.
CENTER NUMBER 6: Graphing Coins- Make a Line Plot
Pull some coins from a bag. Record the coins on the line plot. Answer the questions on the recording sheet.

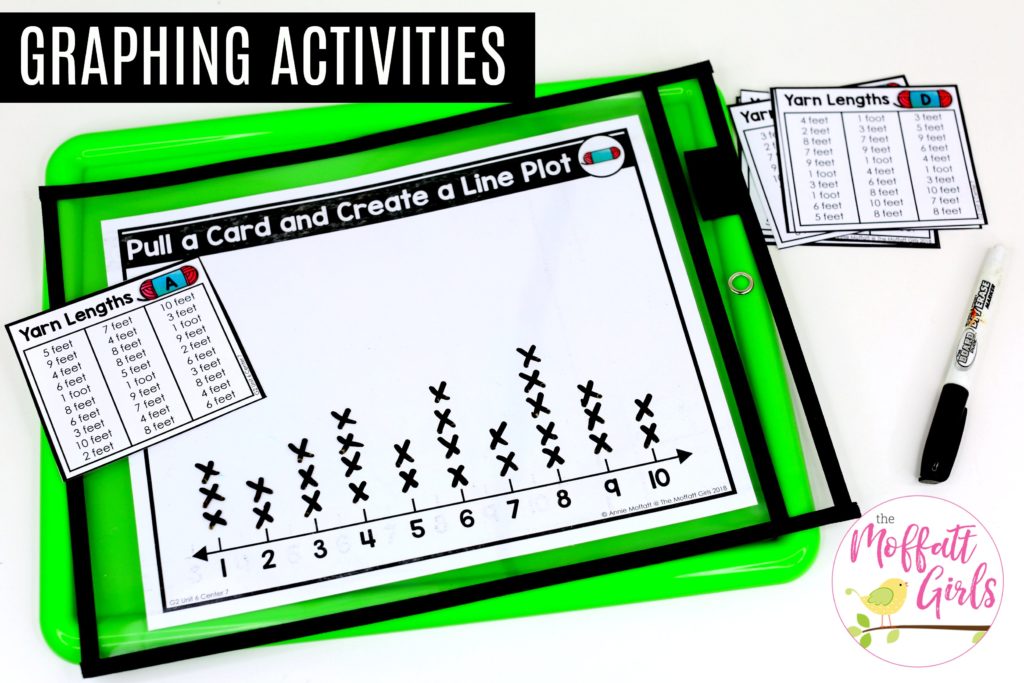
CENTER NUMBER 7: Pull a Card and Create a Line Plot
Flip a card. Record the yarn lengths on the line plot. Answer the questions on the recording sheet.
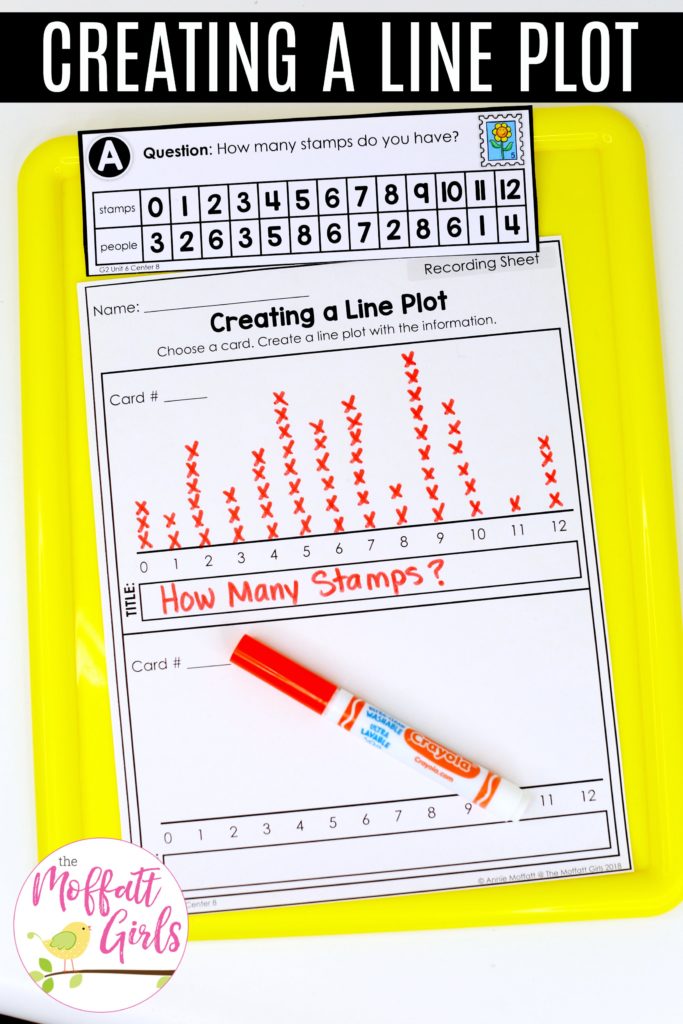
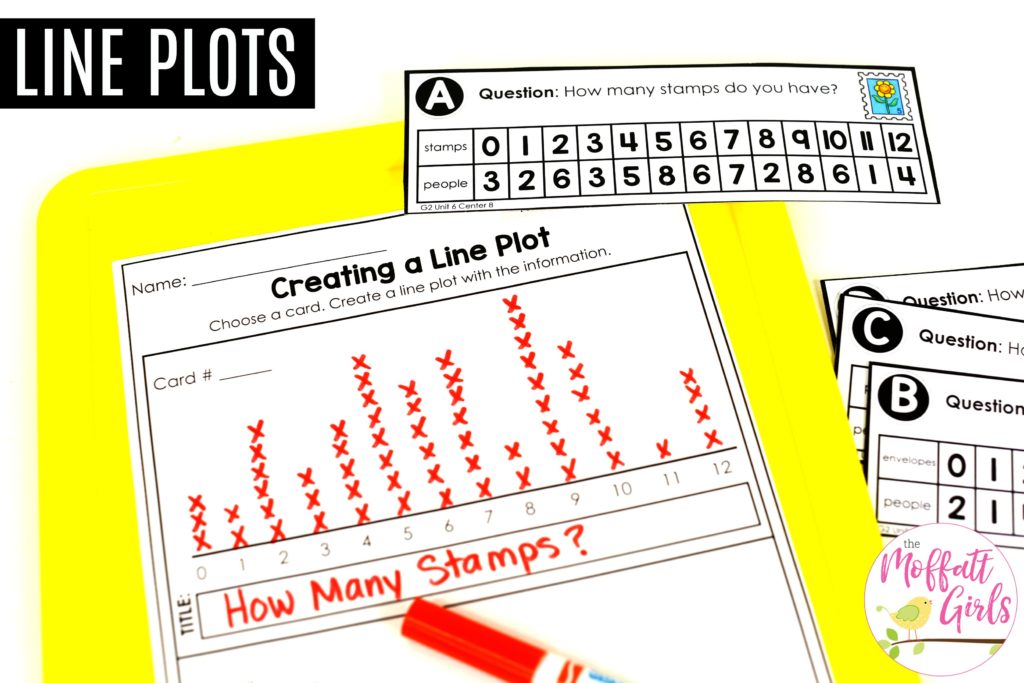
CENTER NUMBER 8: Creating a Line Plot
Pick a card and read the table. Use the information on the table to create a line plot on the recording sheet.
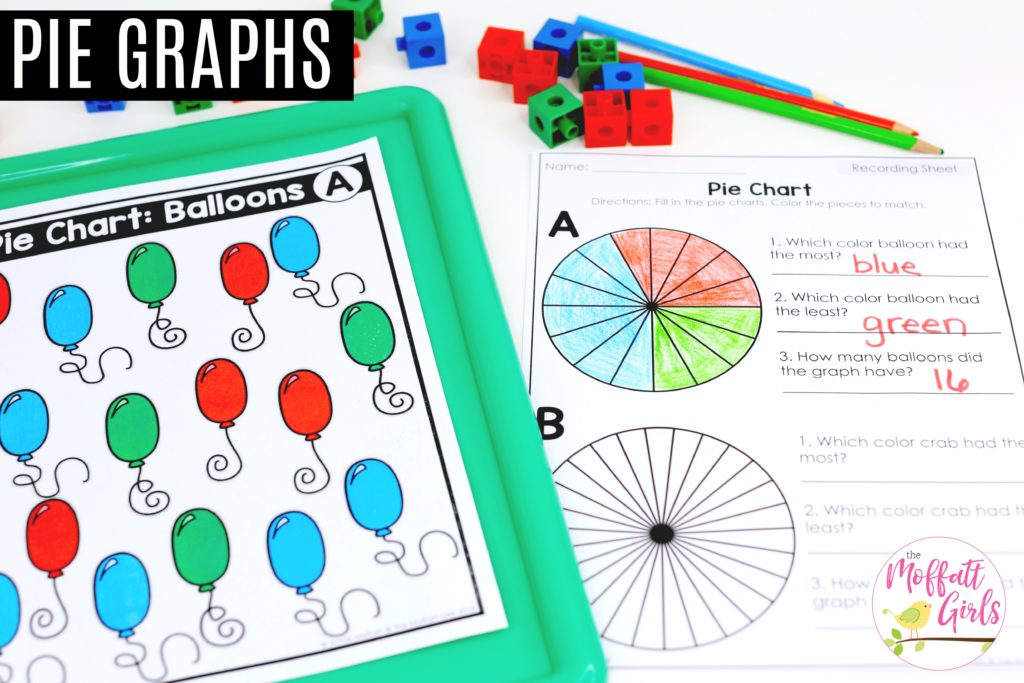
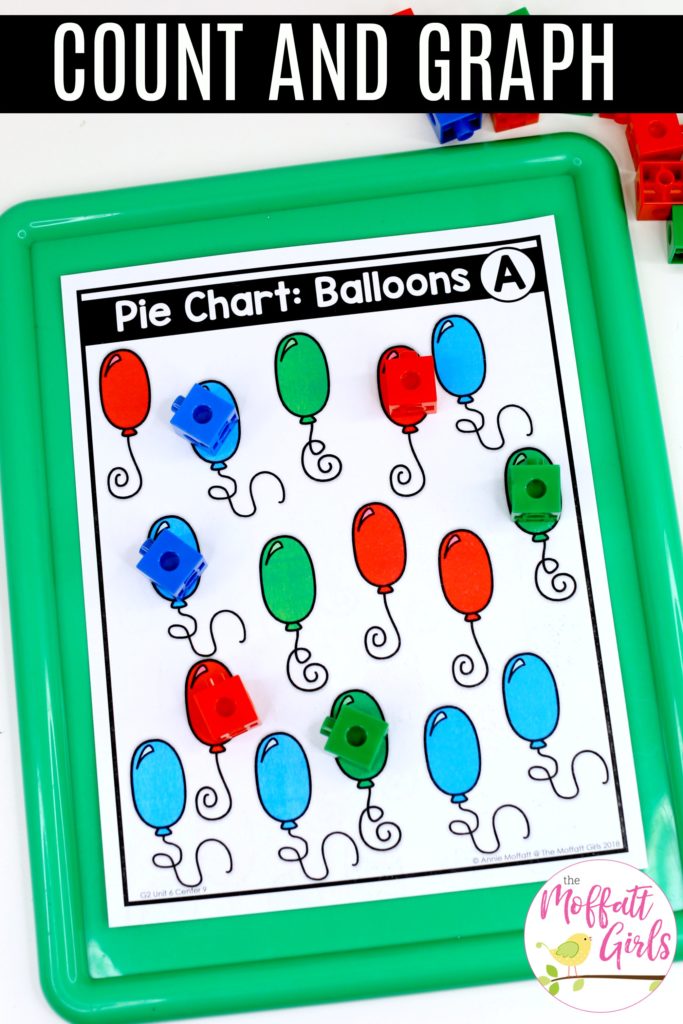
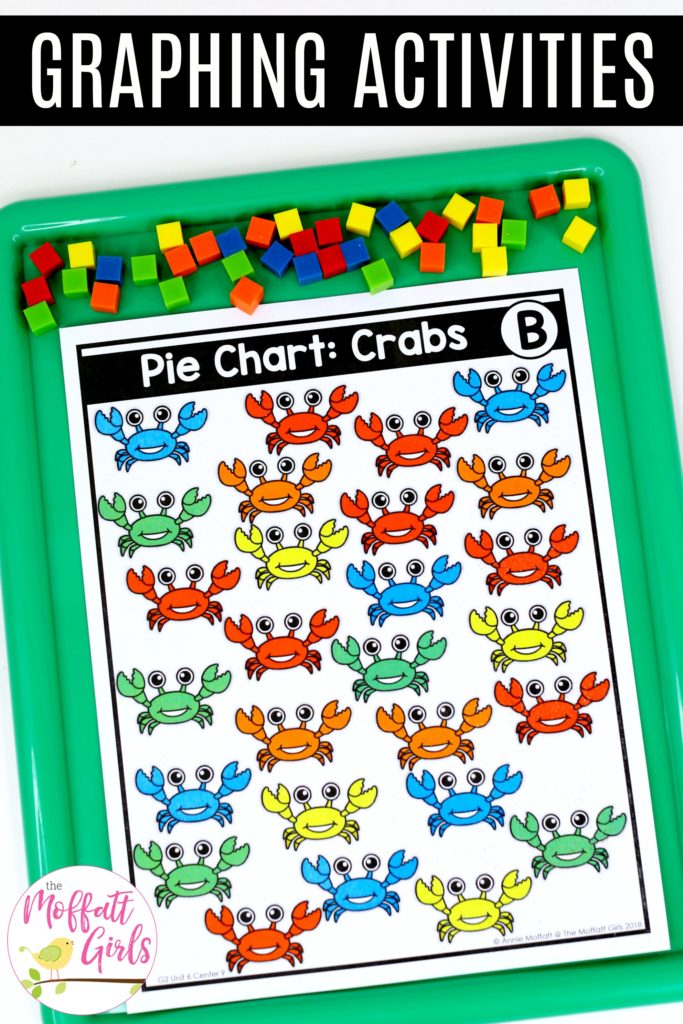
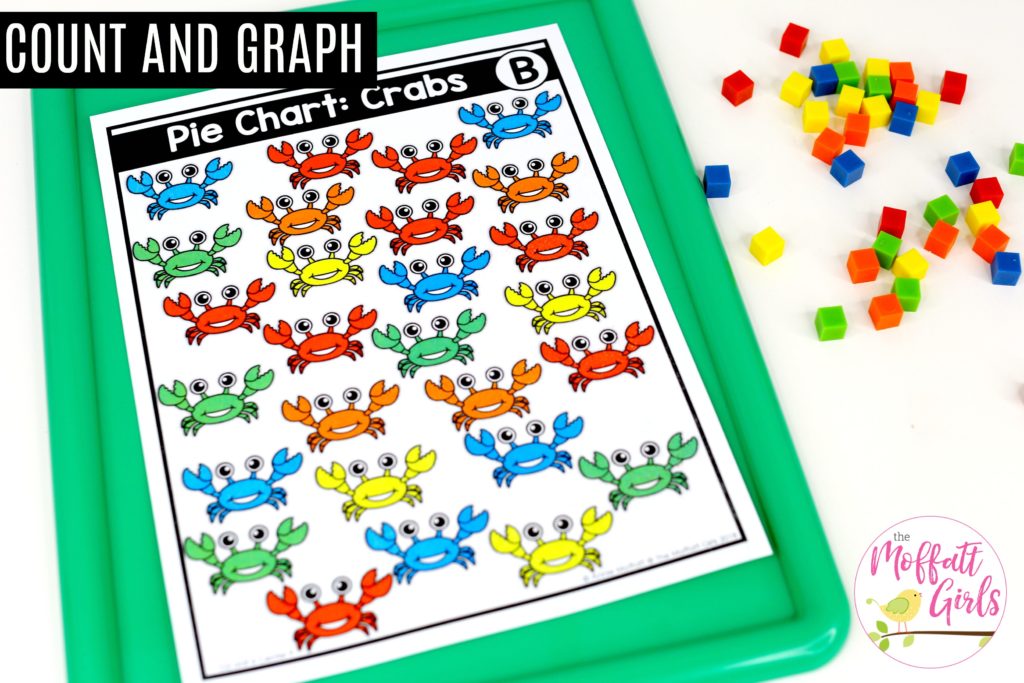
CENTER NUMBER 9: Pie Charts
Fill in the pie charts by coloring in the pieces to match the items on the mat. Answer the questions on the recording sheet.
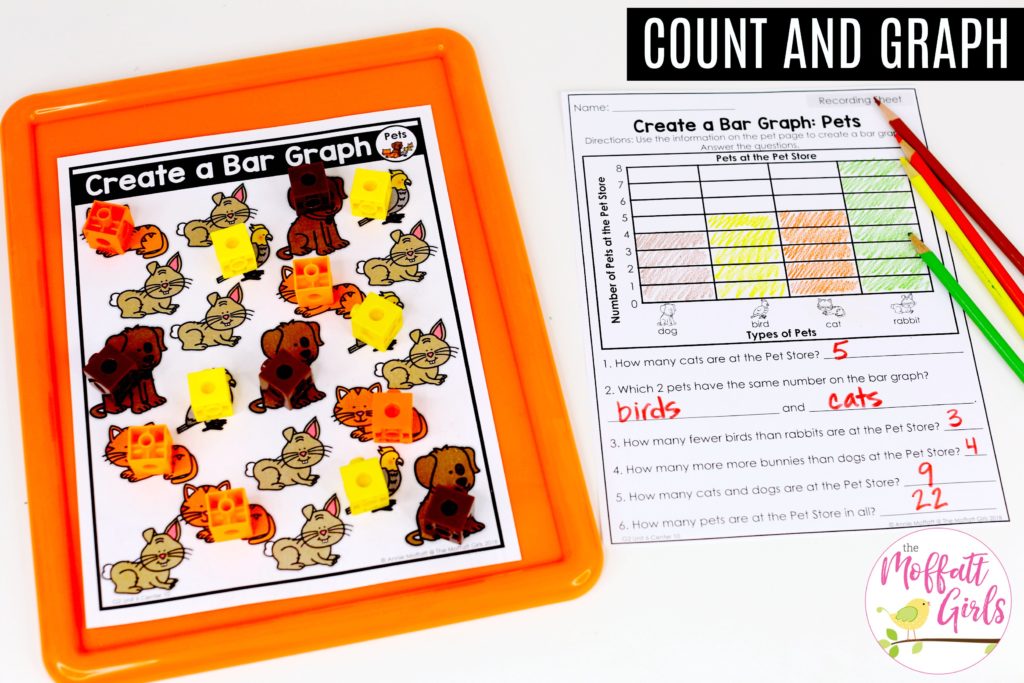
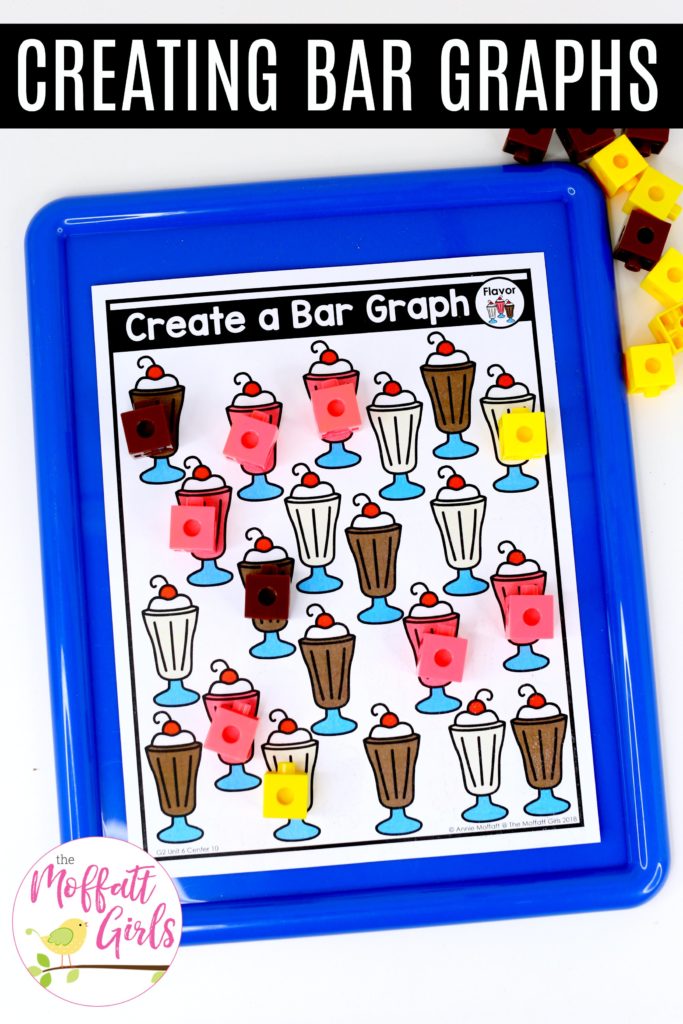
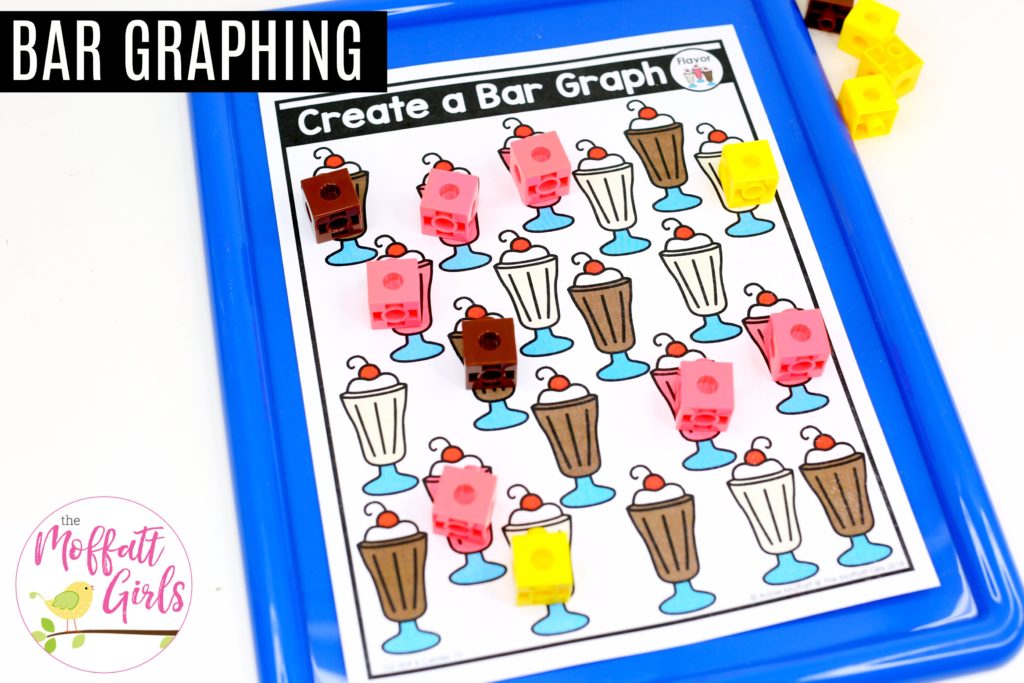
CENTER NUMBER 10: Create a Bar Graph
Count the number of each item. Fill in the bar graph. Answer the questions on the recording sheet.
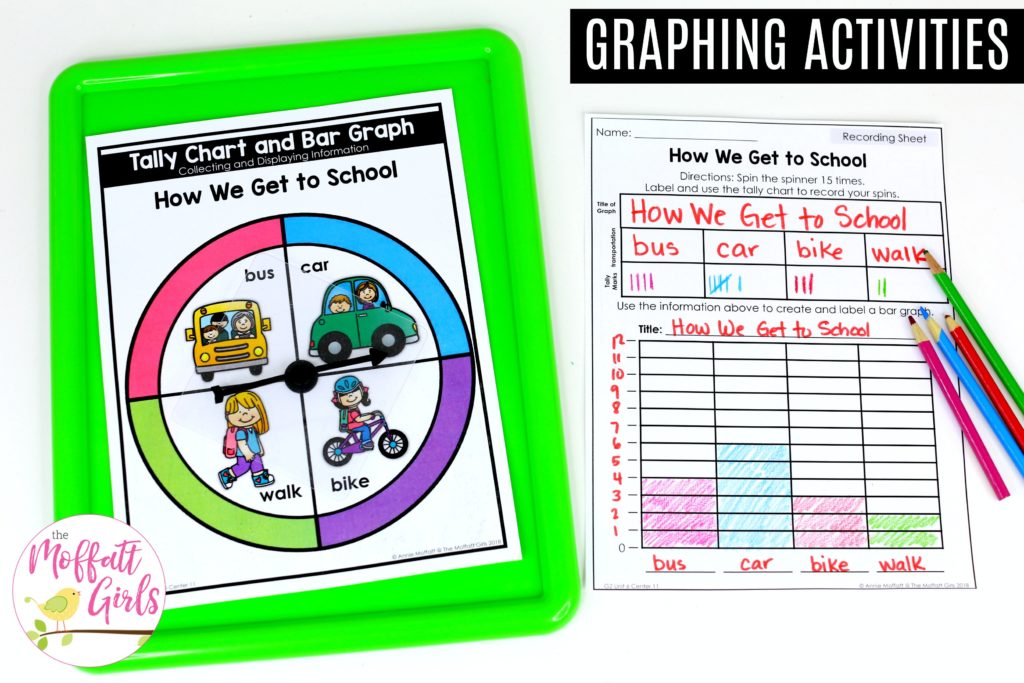
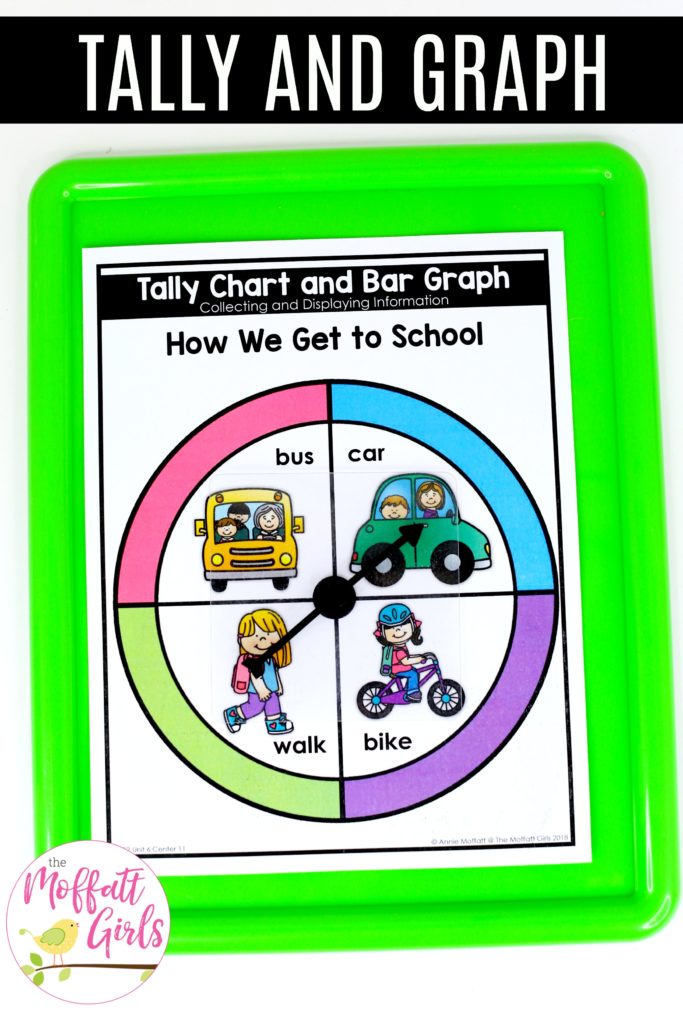
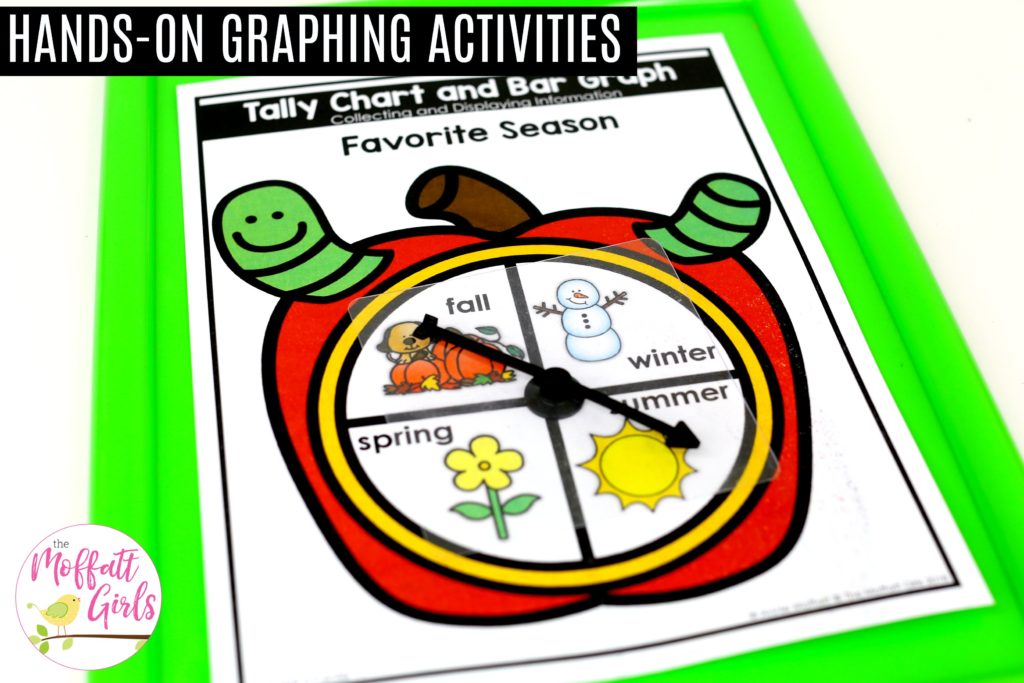
CENTER NUMBER 11: Tally Chart and Bar Graph
Spin the spinner 15 times. Tally your spins on the chart. Create and label a bar graph to match your results.
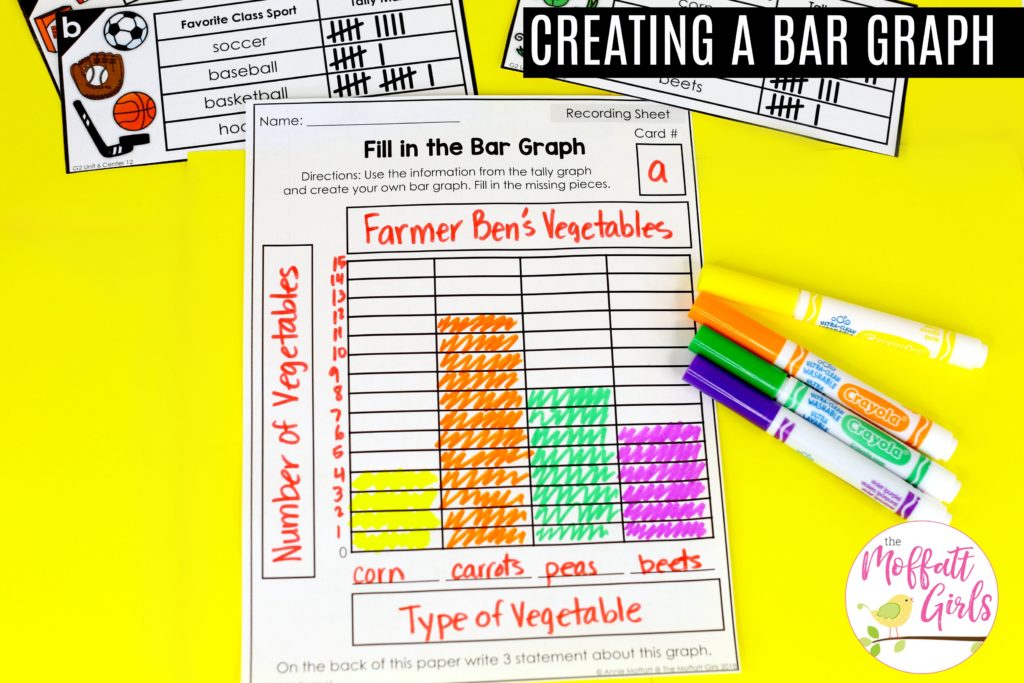
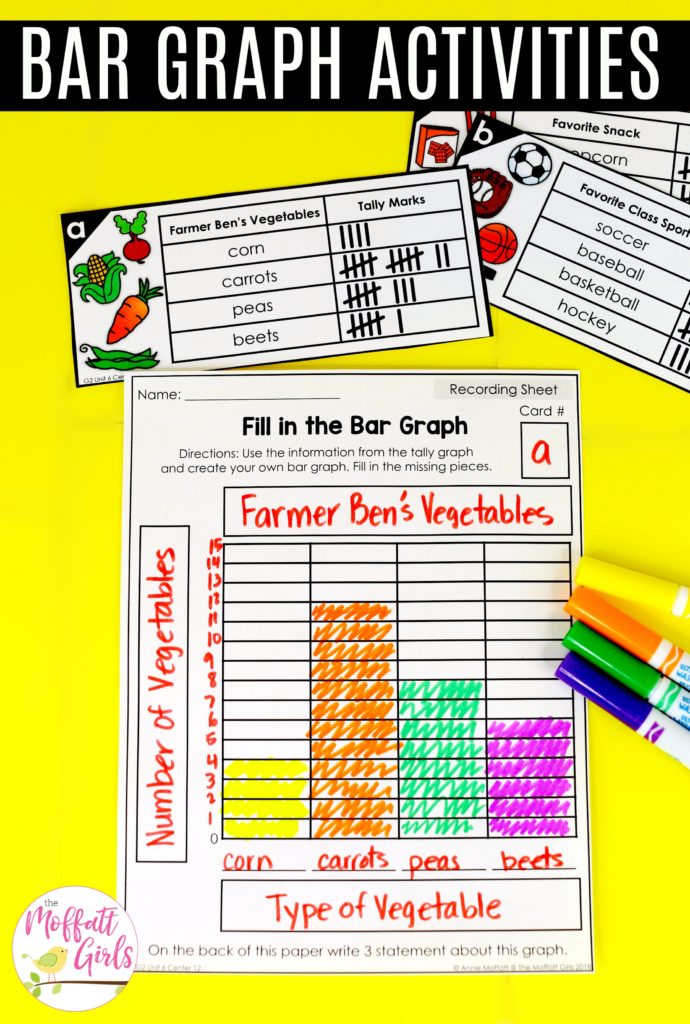
CENTER NUMBER 12: Fill in the Bar Graph
Count each item. Use the information to fill in the bar graph. Answer the questions on the recording sheet.
For each page, there is a grade level standard attached so you know EXACTLY what you are covering! You can feel confident that ALL the standards for Second Grade are being covered!

HOW DO I ORGANIZE THE UNITS?
I chose to store the math centers in Sterilite bins, because they don’t take up too much space. It is a tight fit, but I find that they work nicely for me. However, if you choose, you could store the centers in a larger container as well. Within the bin, each math center is stored in a gallon sized ziplock baggie.
Click Here to view the 2nd Math Made Fun Unit 1 post.
You can purchase Unit 6 individually HERE or
SAVE BIG WITH THE BUNDLE HERE


Leave a Reply