





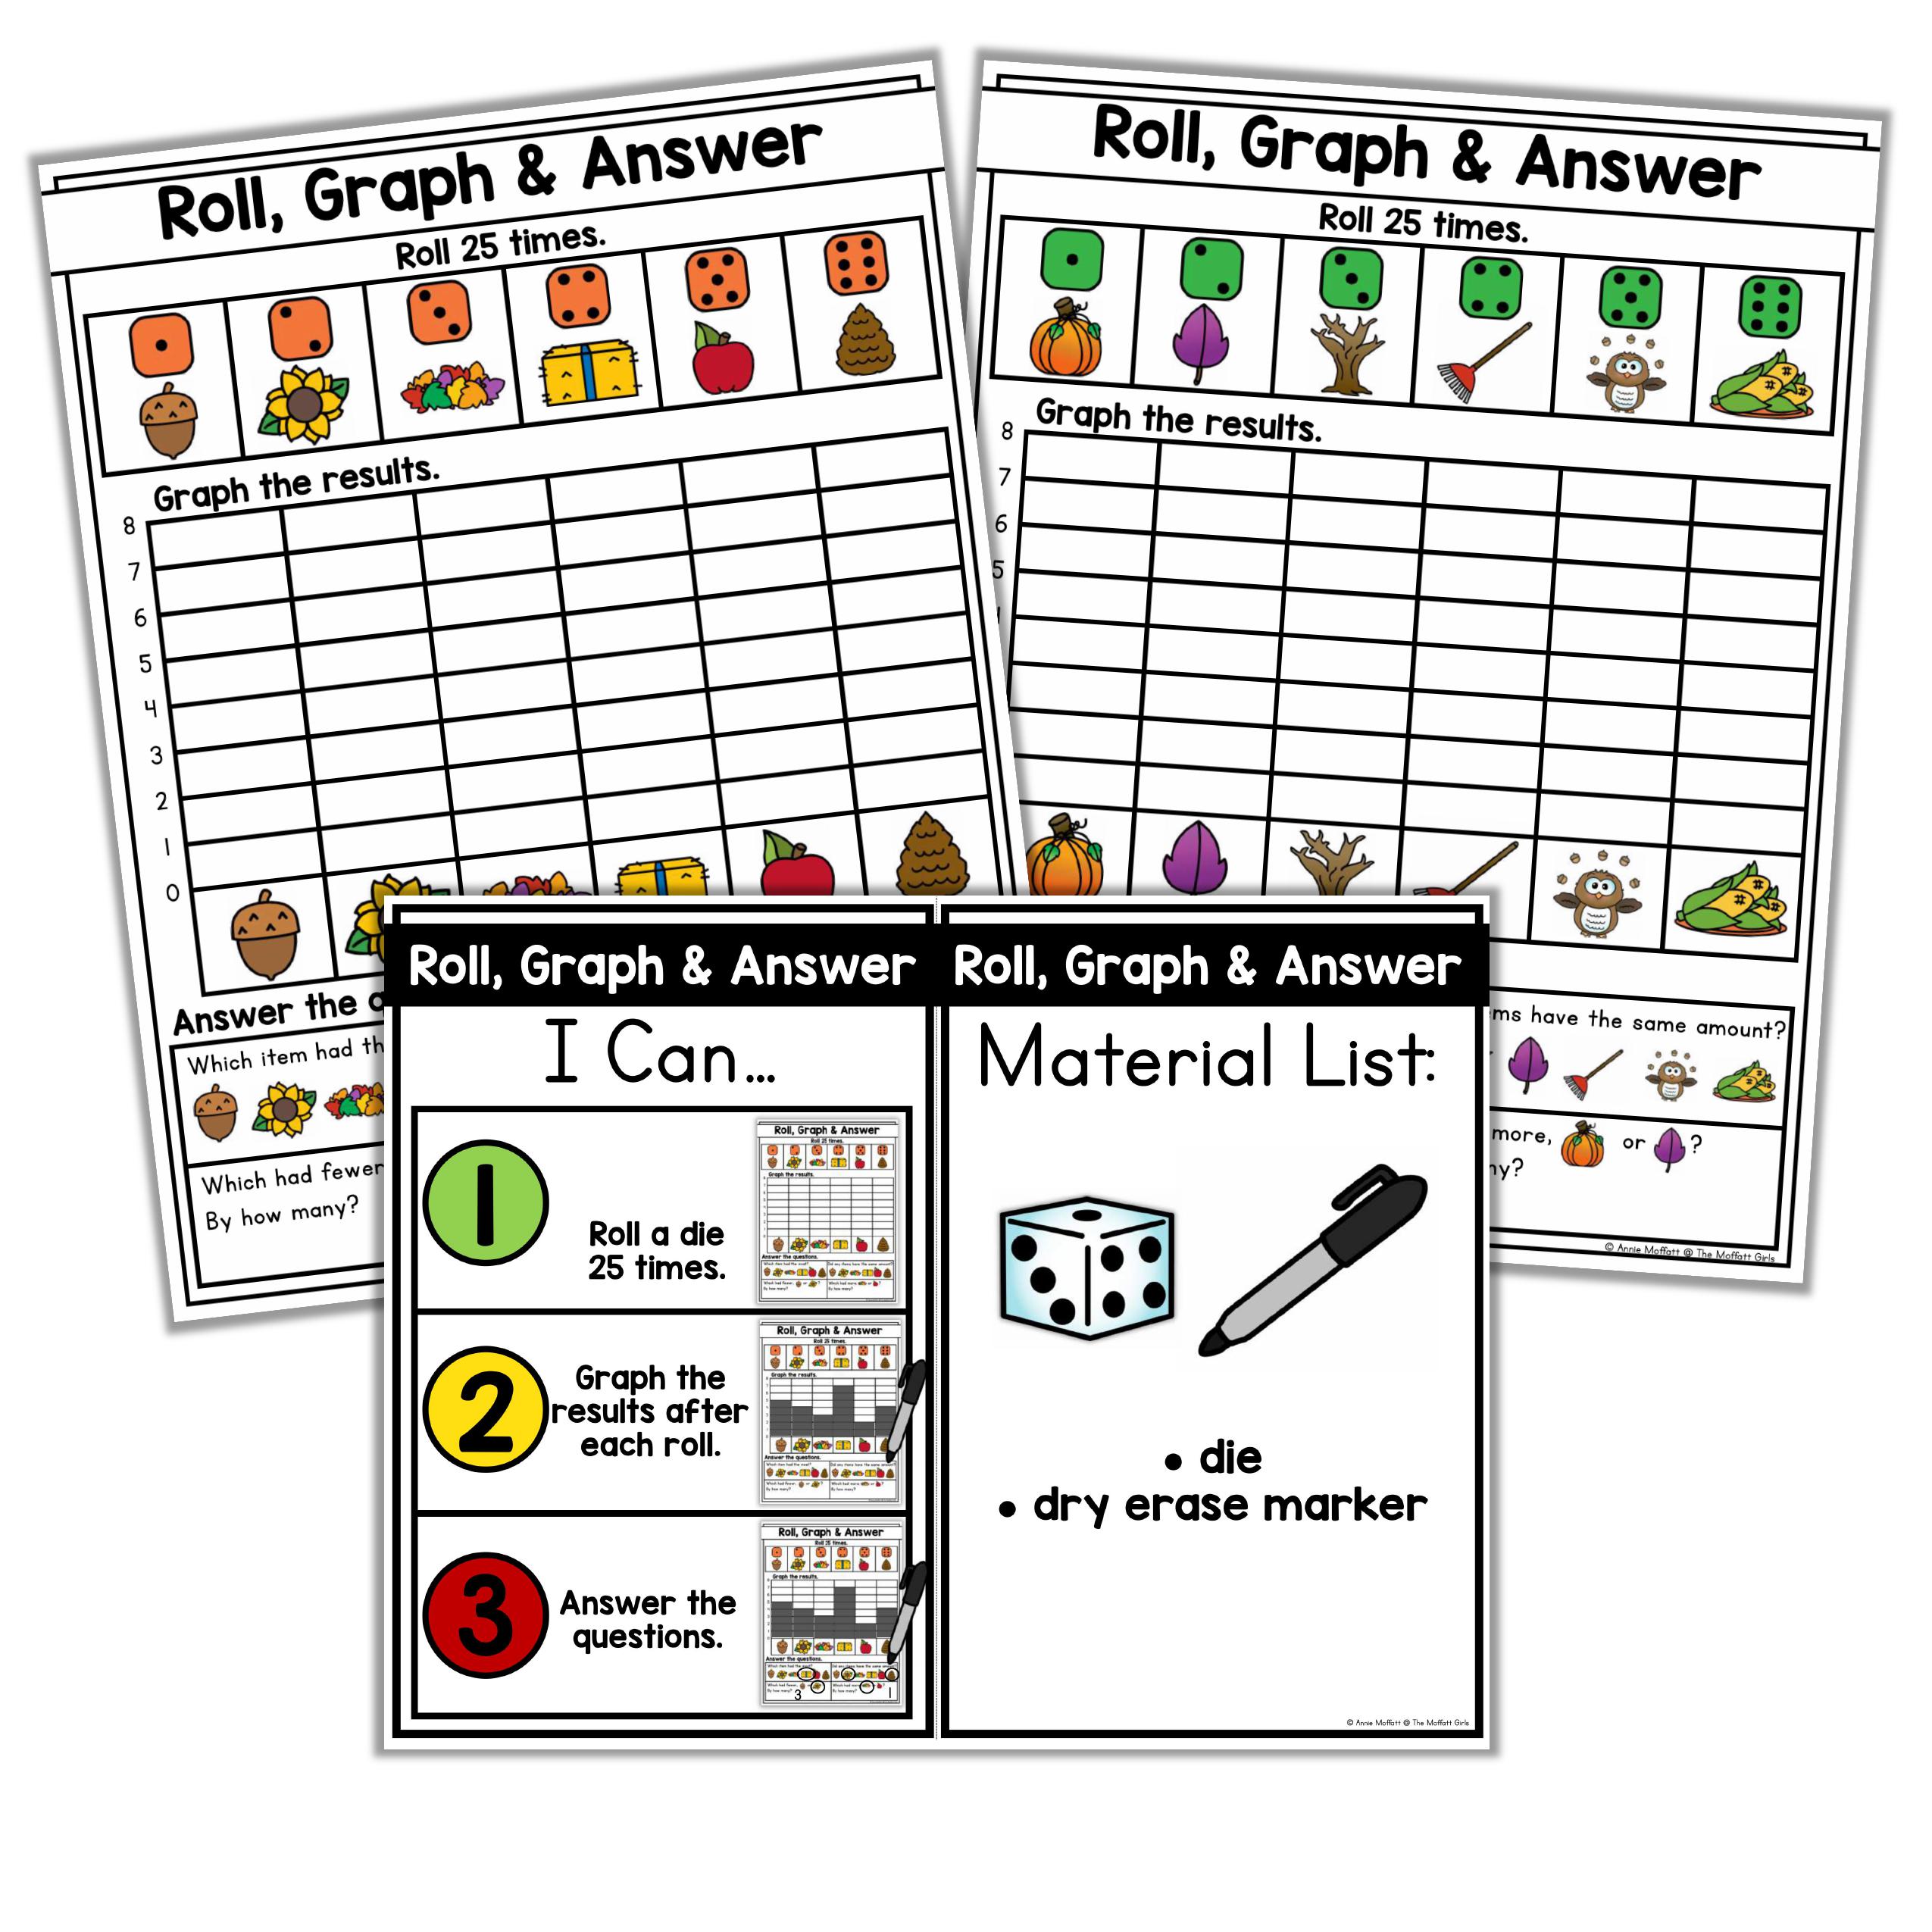
Roll, Graph and Answer Fall Bar Graph Math Center for 3rd Grade
- Gold Key
- Master Key
Description
Students roll a die 25 times, graph each result with fall pictures like pumpkins, leaves, acorns, candy corn and apples, then answer how many more and how many fewer questions. A 3rd grade data and graphing center for October morning bins. Supports CCSS 3.MD.B.3.