






Description
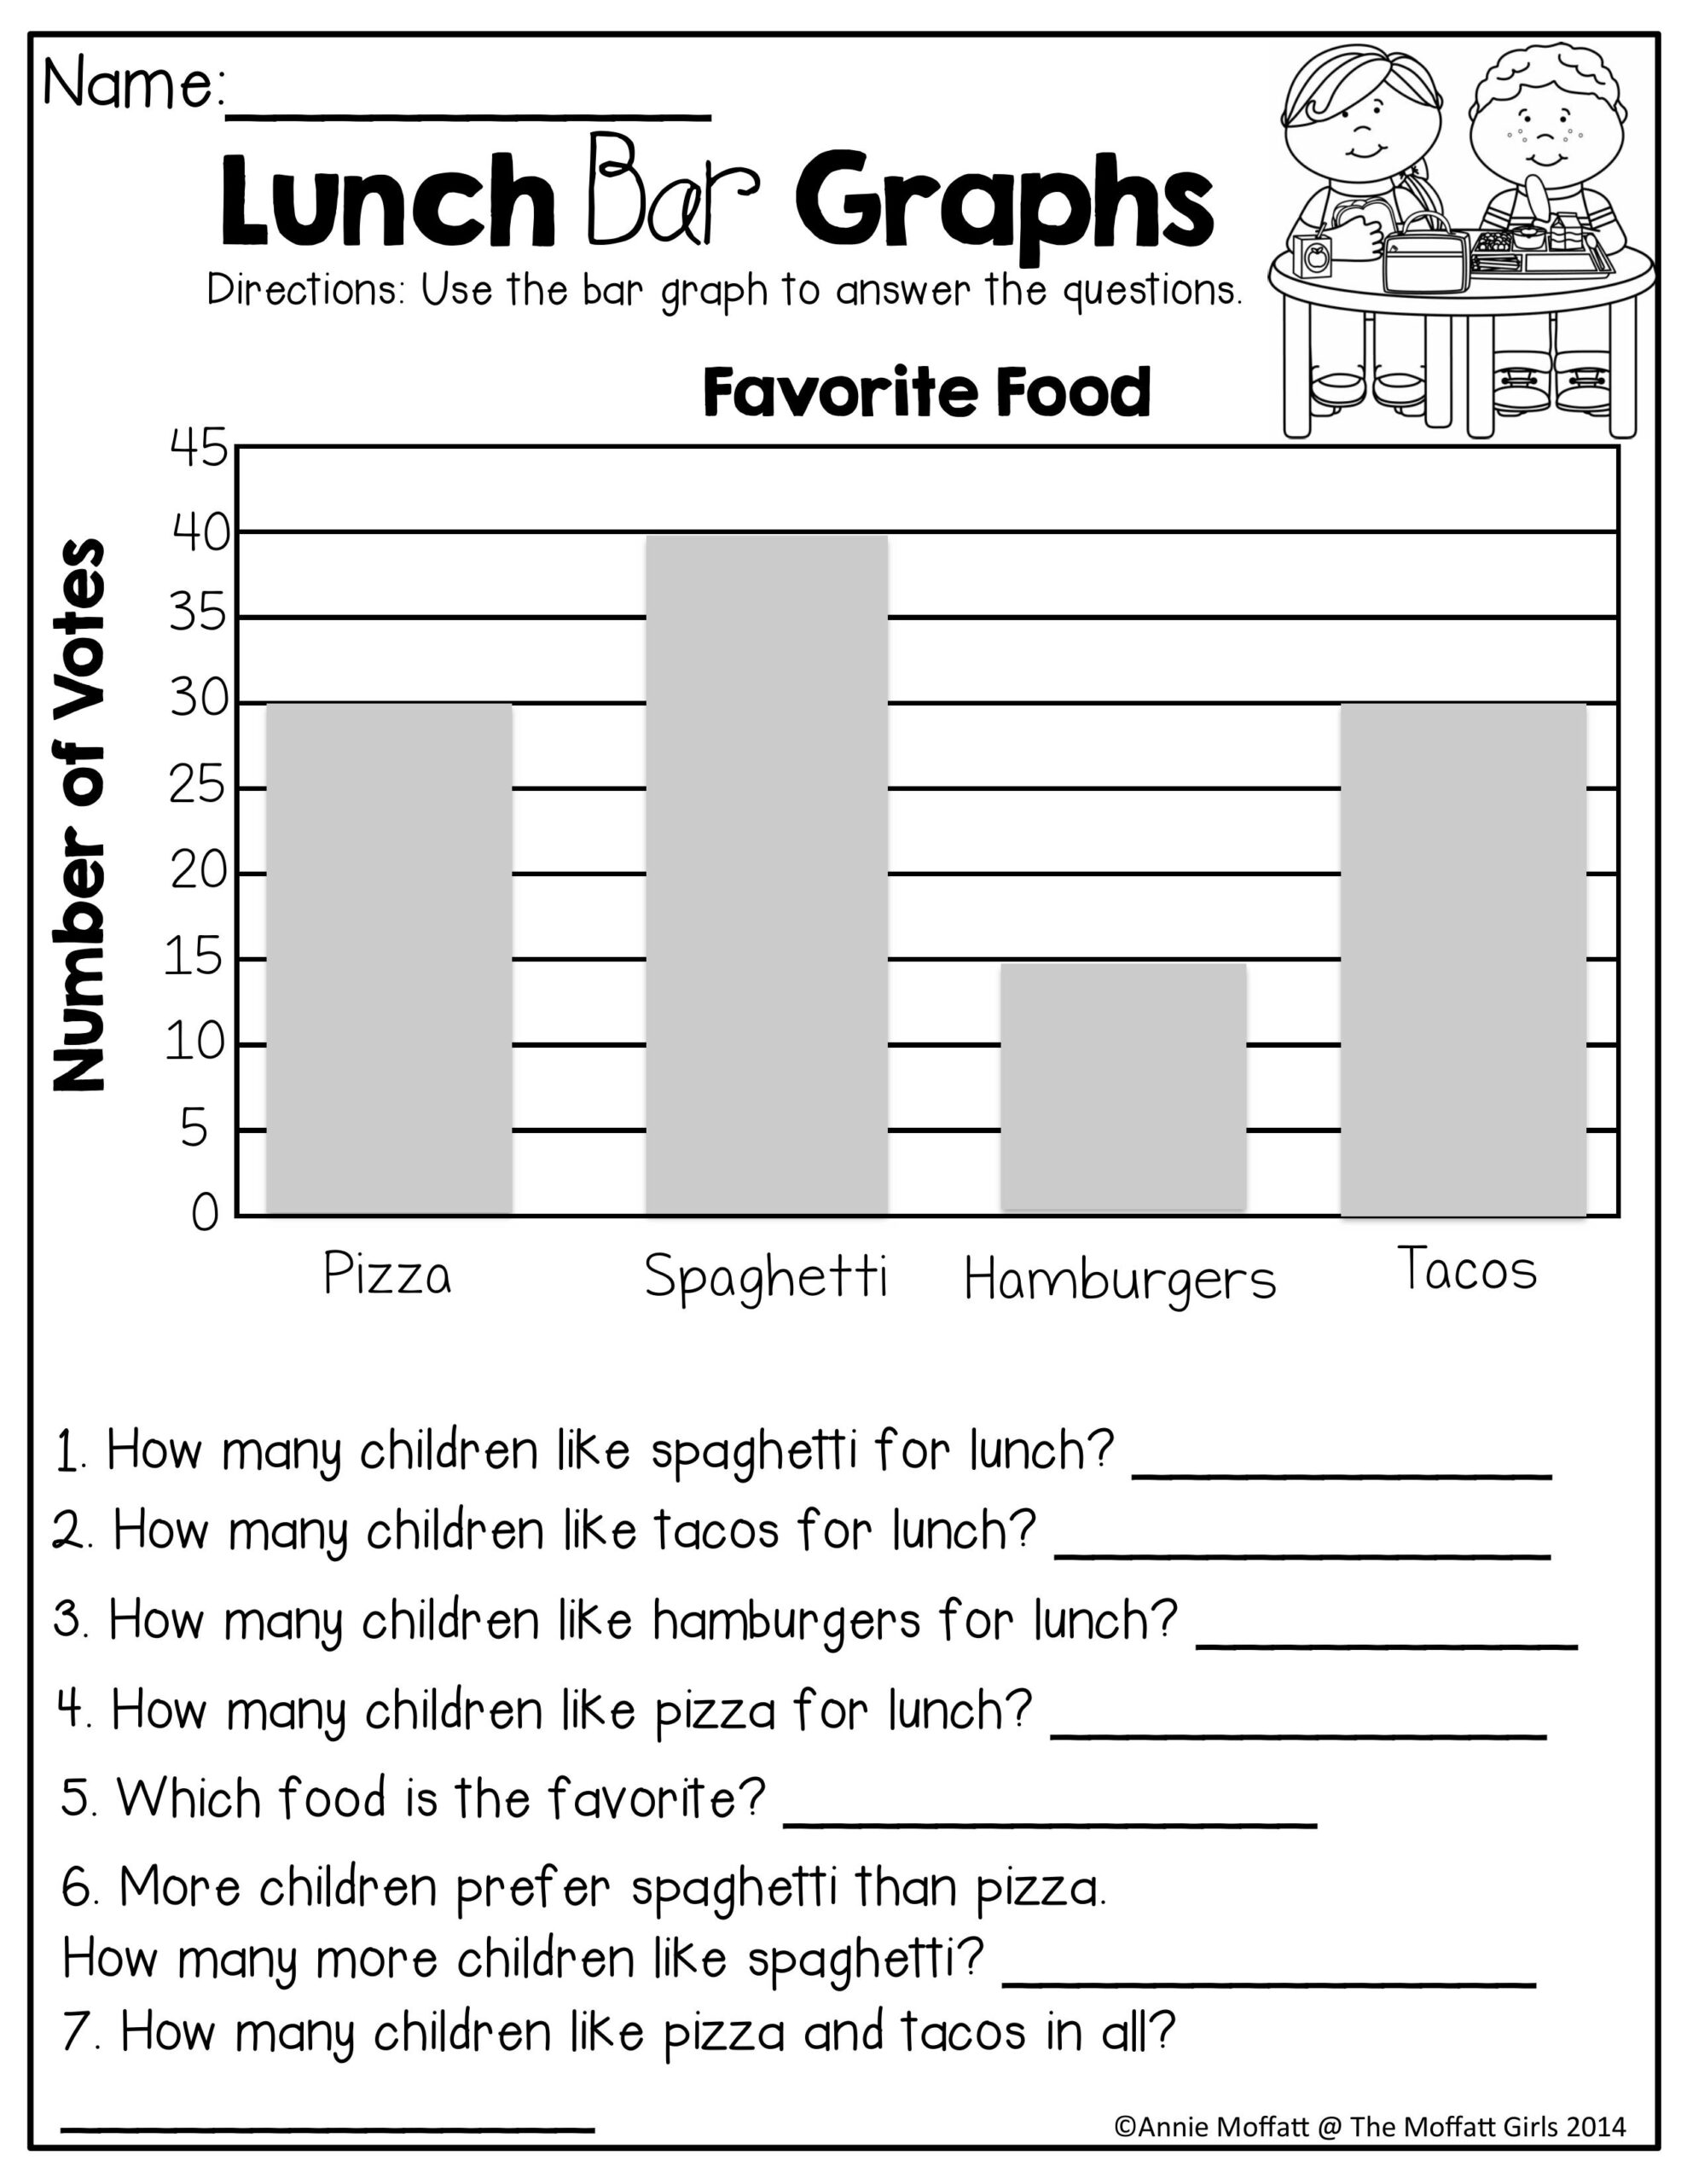
Students read a favorite lunch food bar graph showing pizza, spaghetti, hamburgers and tacos, then answer how many, which is the favorite and how many more questions. A no prep 2nd grade graphing and data analysis printable for math centers and back to school review. CCSS 2.MD.D.10.